Mapping of Flanders, Belgium
This project, undertaken during my exchange semester at KU Leuven, belgium, aims to gain an understanding of urban development across history through the lens of variables such as nature, mobility, settlement and income. This study layers green spaces, roads, rivers and water bodies and settlement patterns from 1777 to 2019. Using historical maps, these elements were able to be studied. From this exercise, a series of analyses were able to be conducted which compared the development of each category along with current income surveys of Belgium. From this, conclusions could be drawn between certain characteristics and wealth. for instance by combining layers of green space, waterways and income, it can clearly be seen that high densities of wealthy people lived in the most nature dense areas of Flanders. On the other hand, areas of vast farming, with little natural green spaces and waterways were hosts to majority of lower income households. this included the dense urban hubs. These analyses are presented below.
Rivers
-
1777
-
1846
-
2019
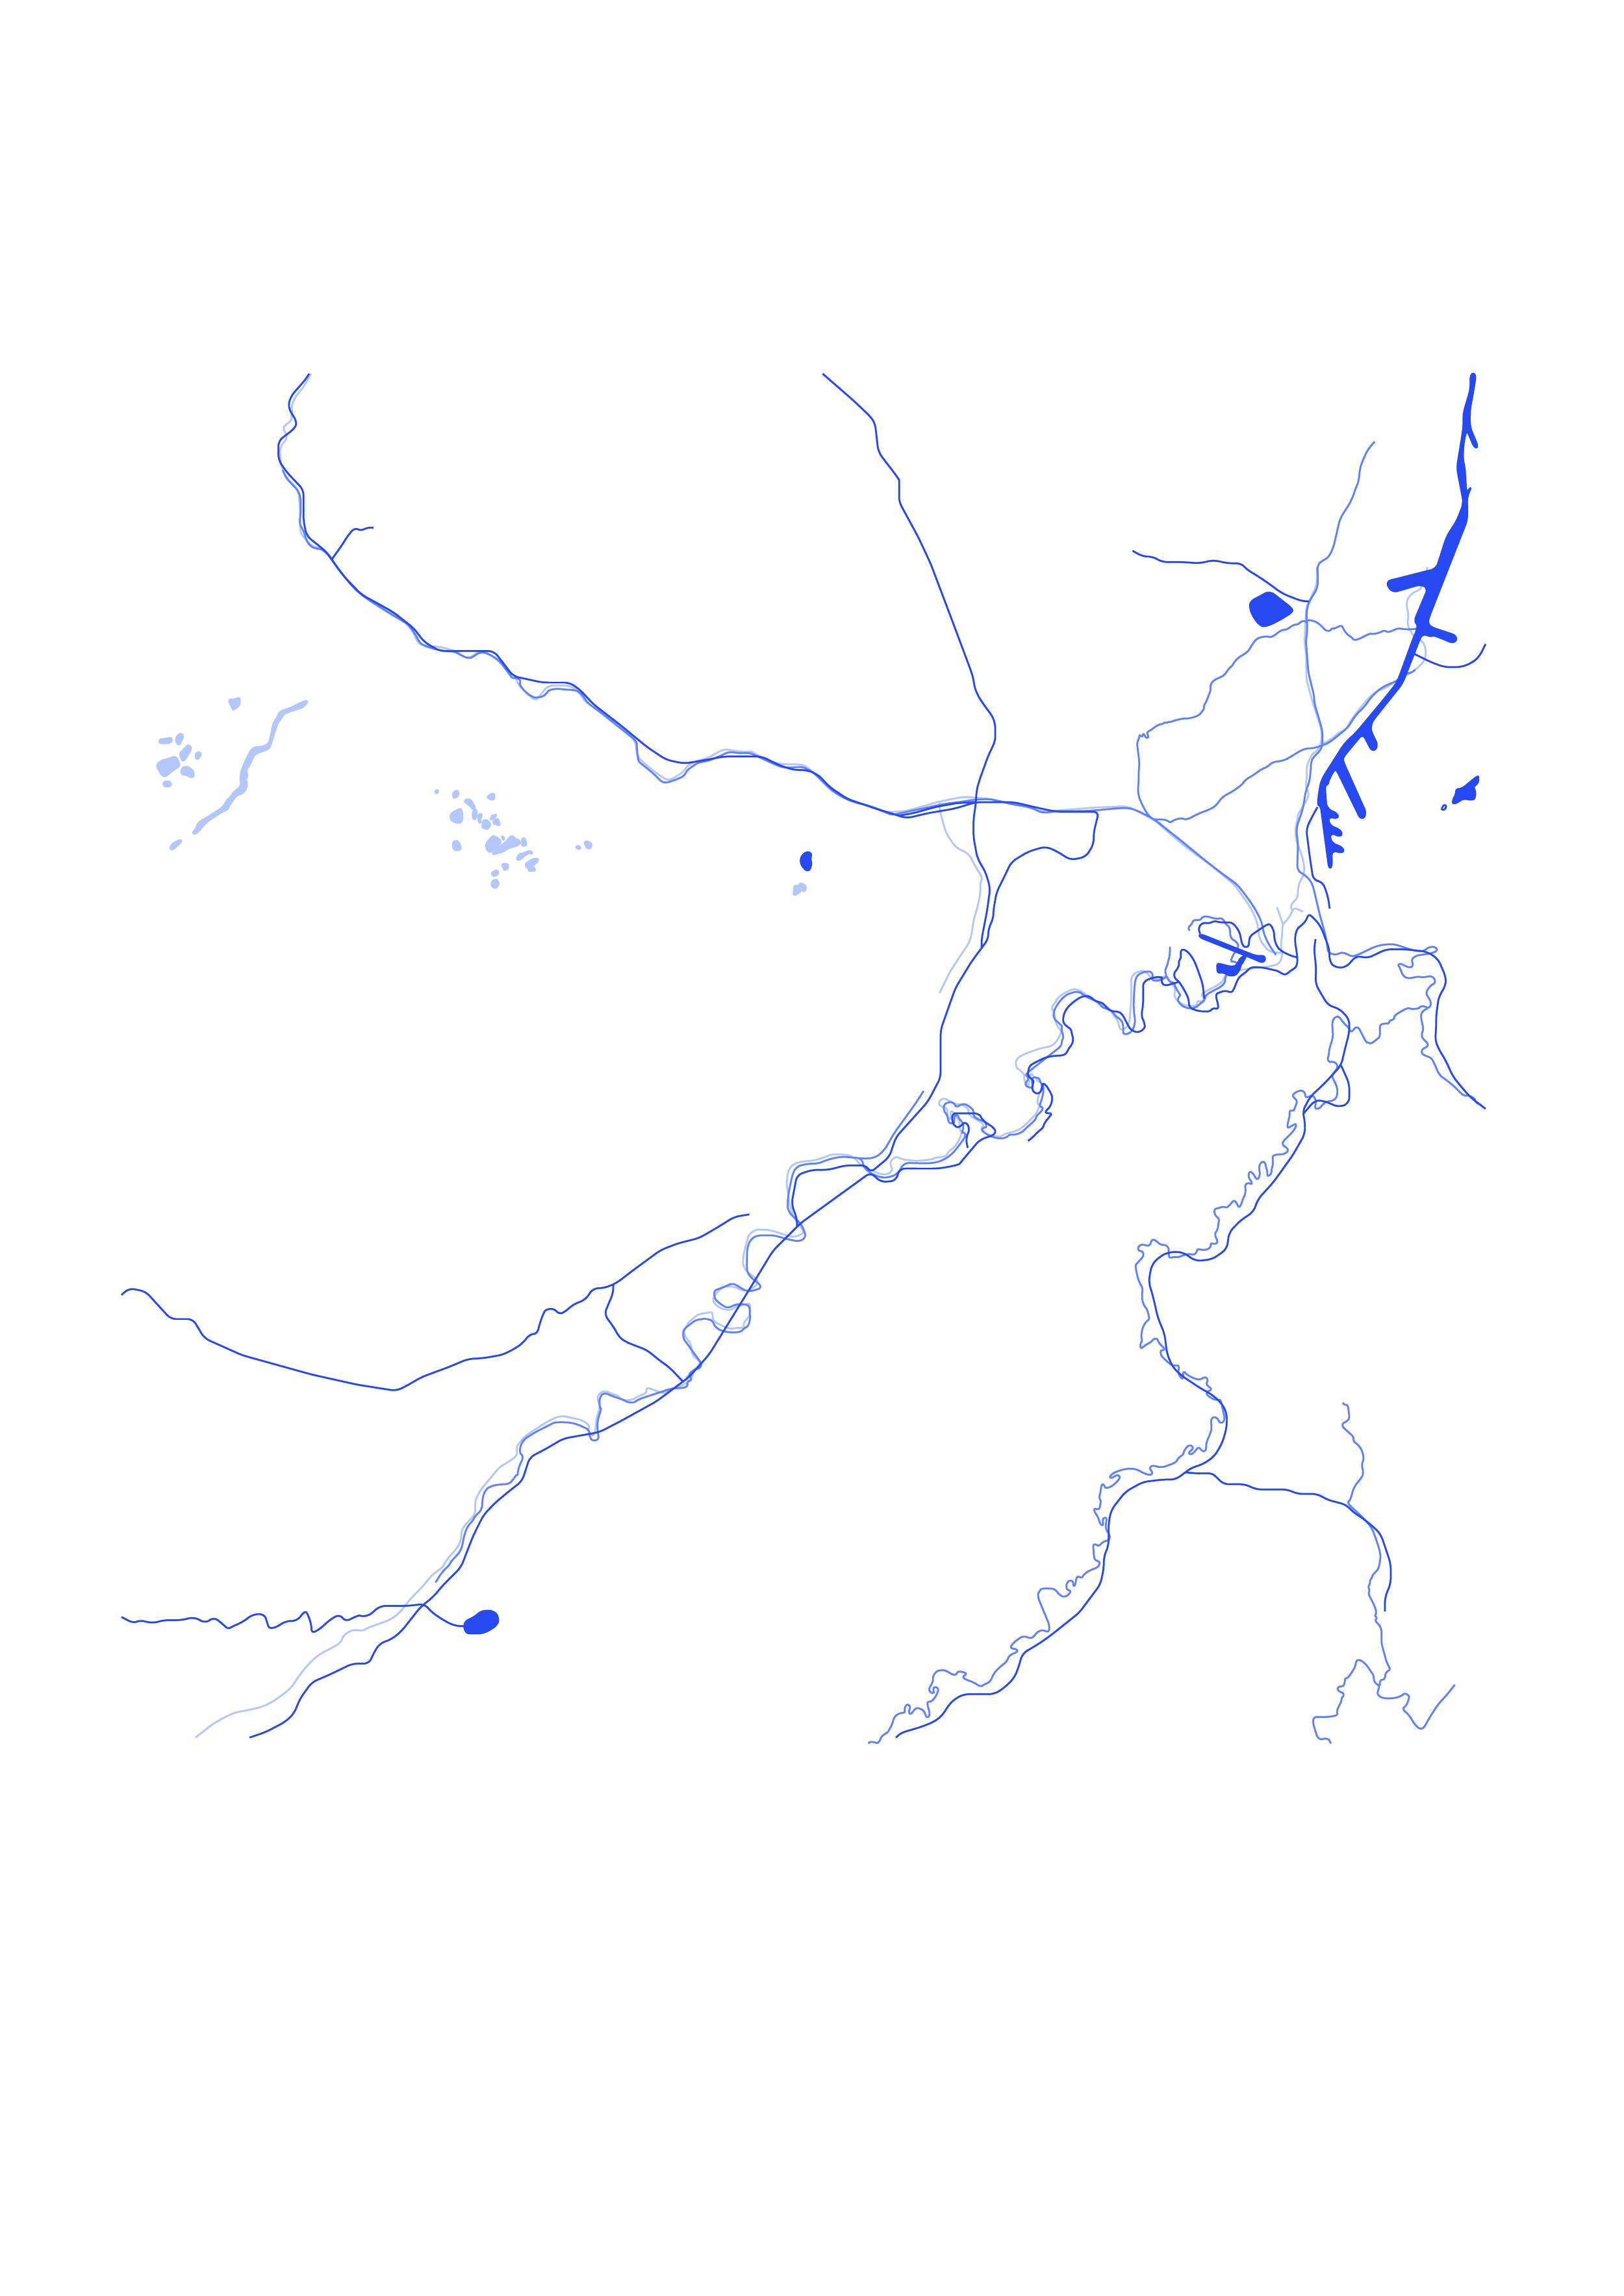
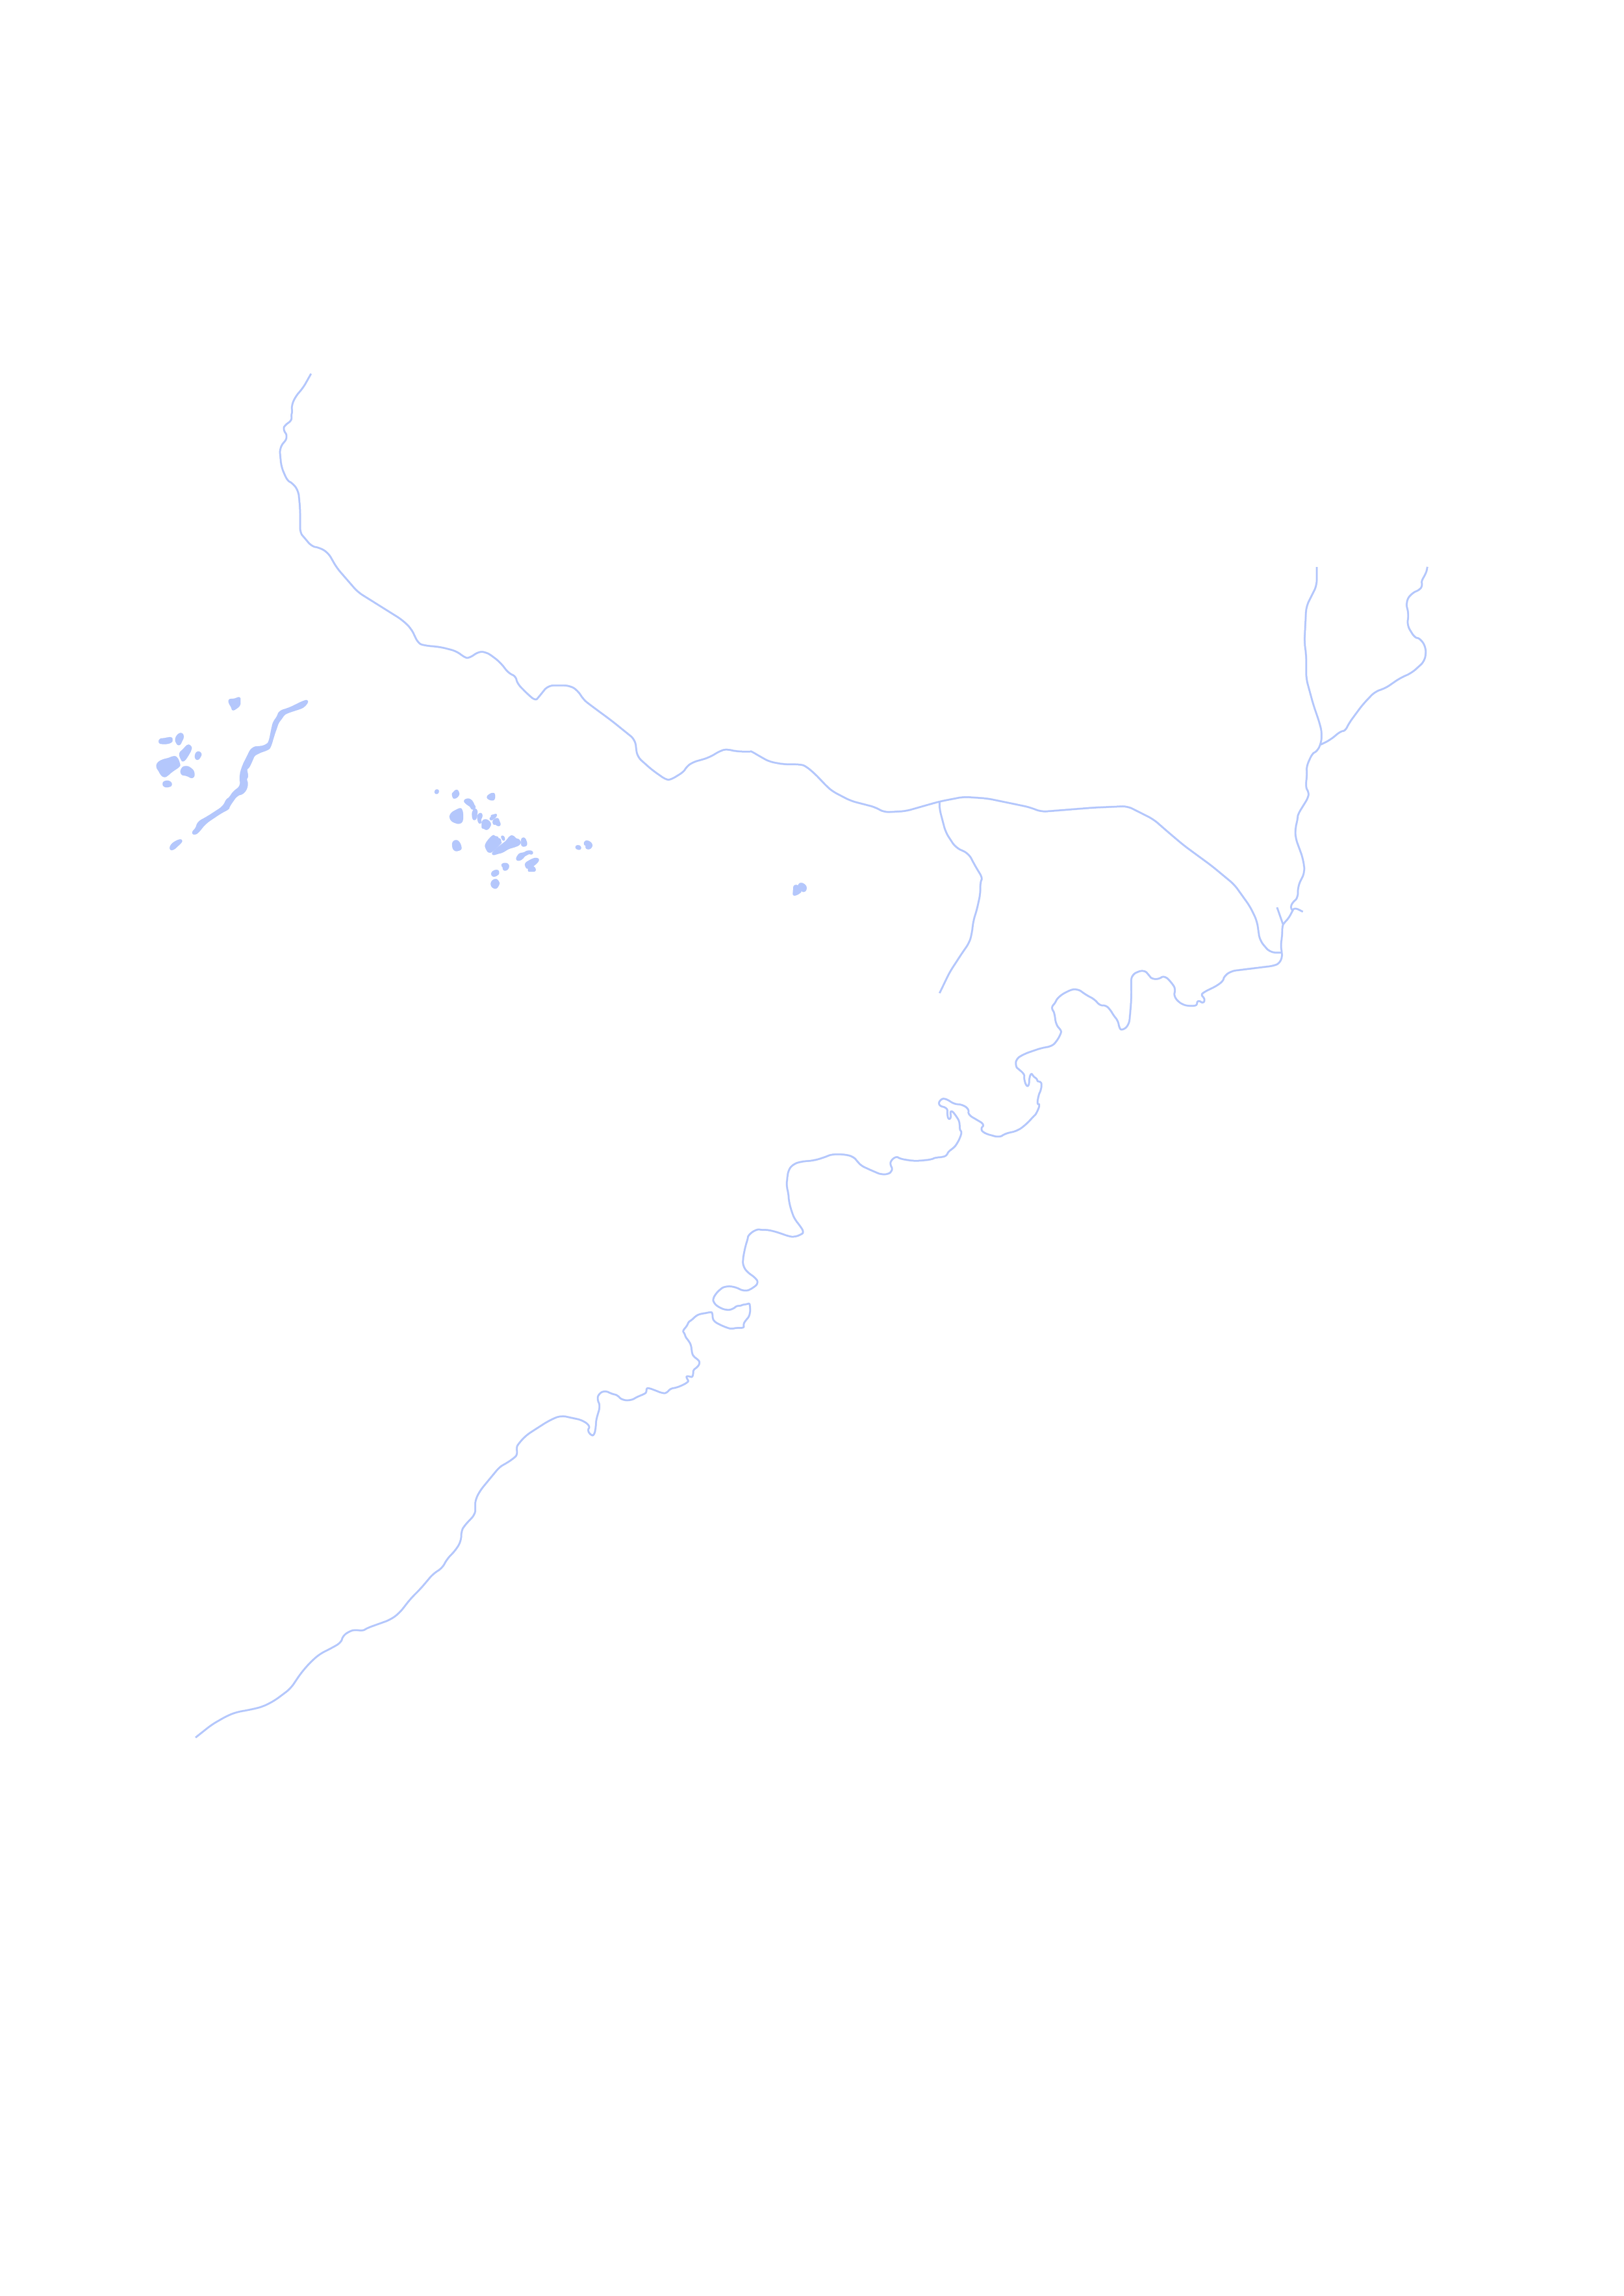
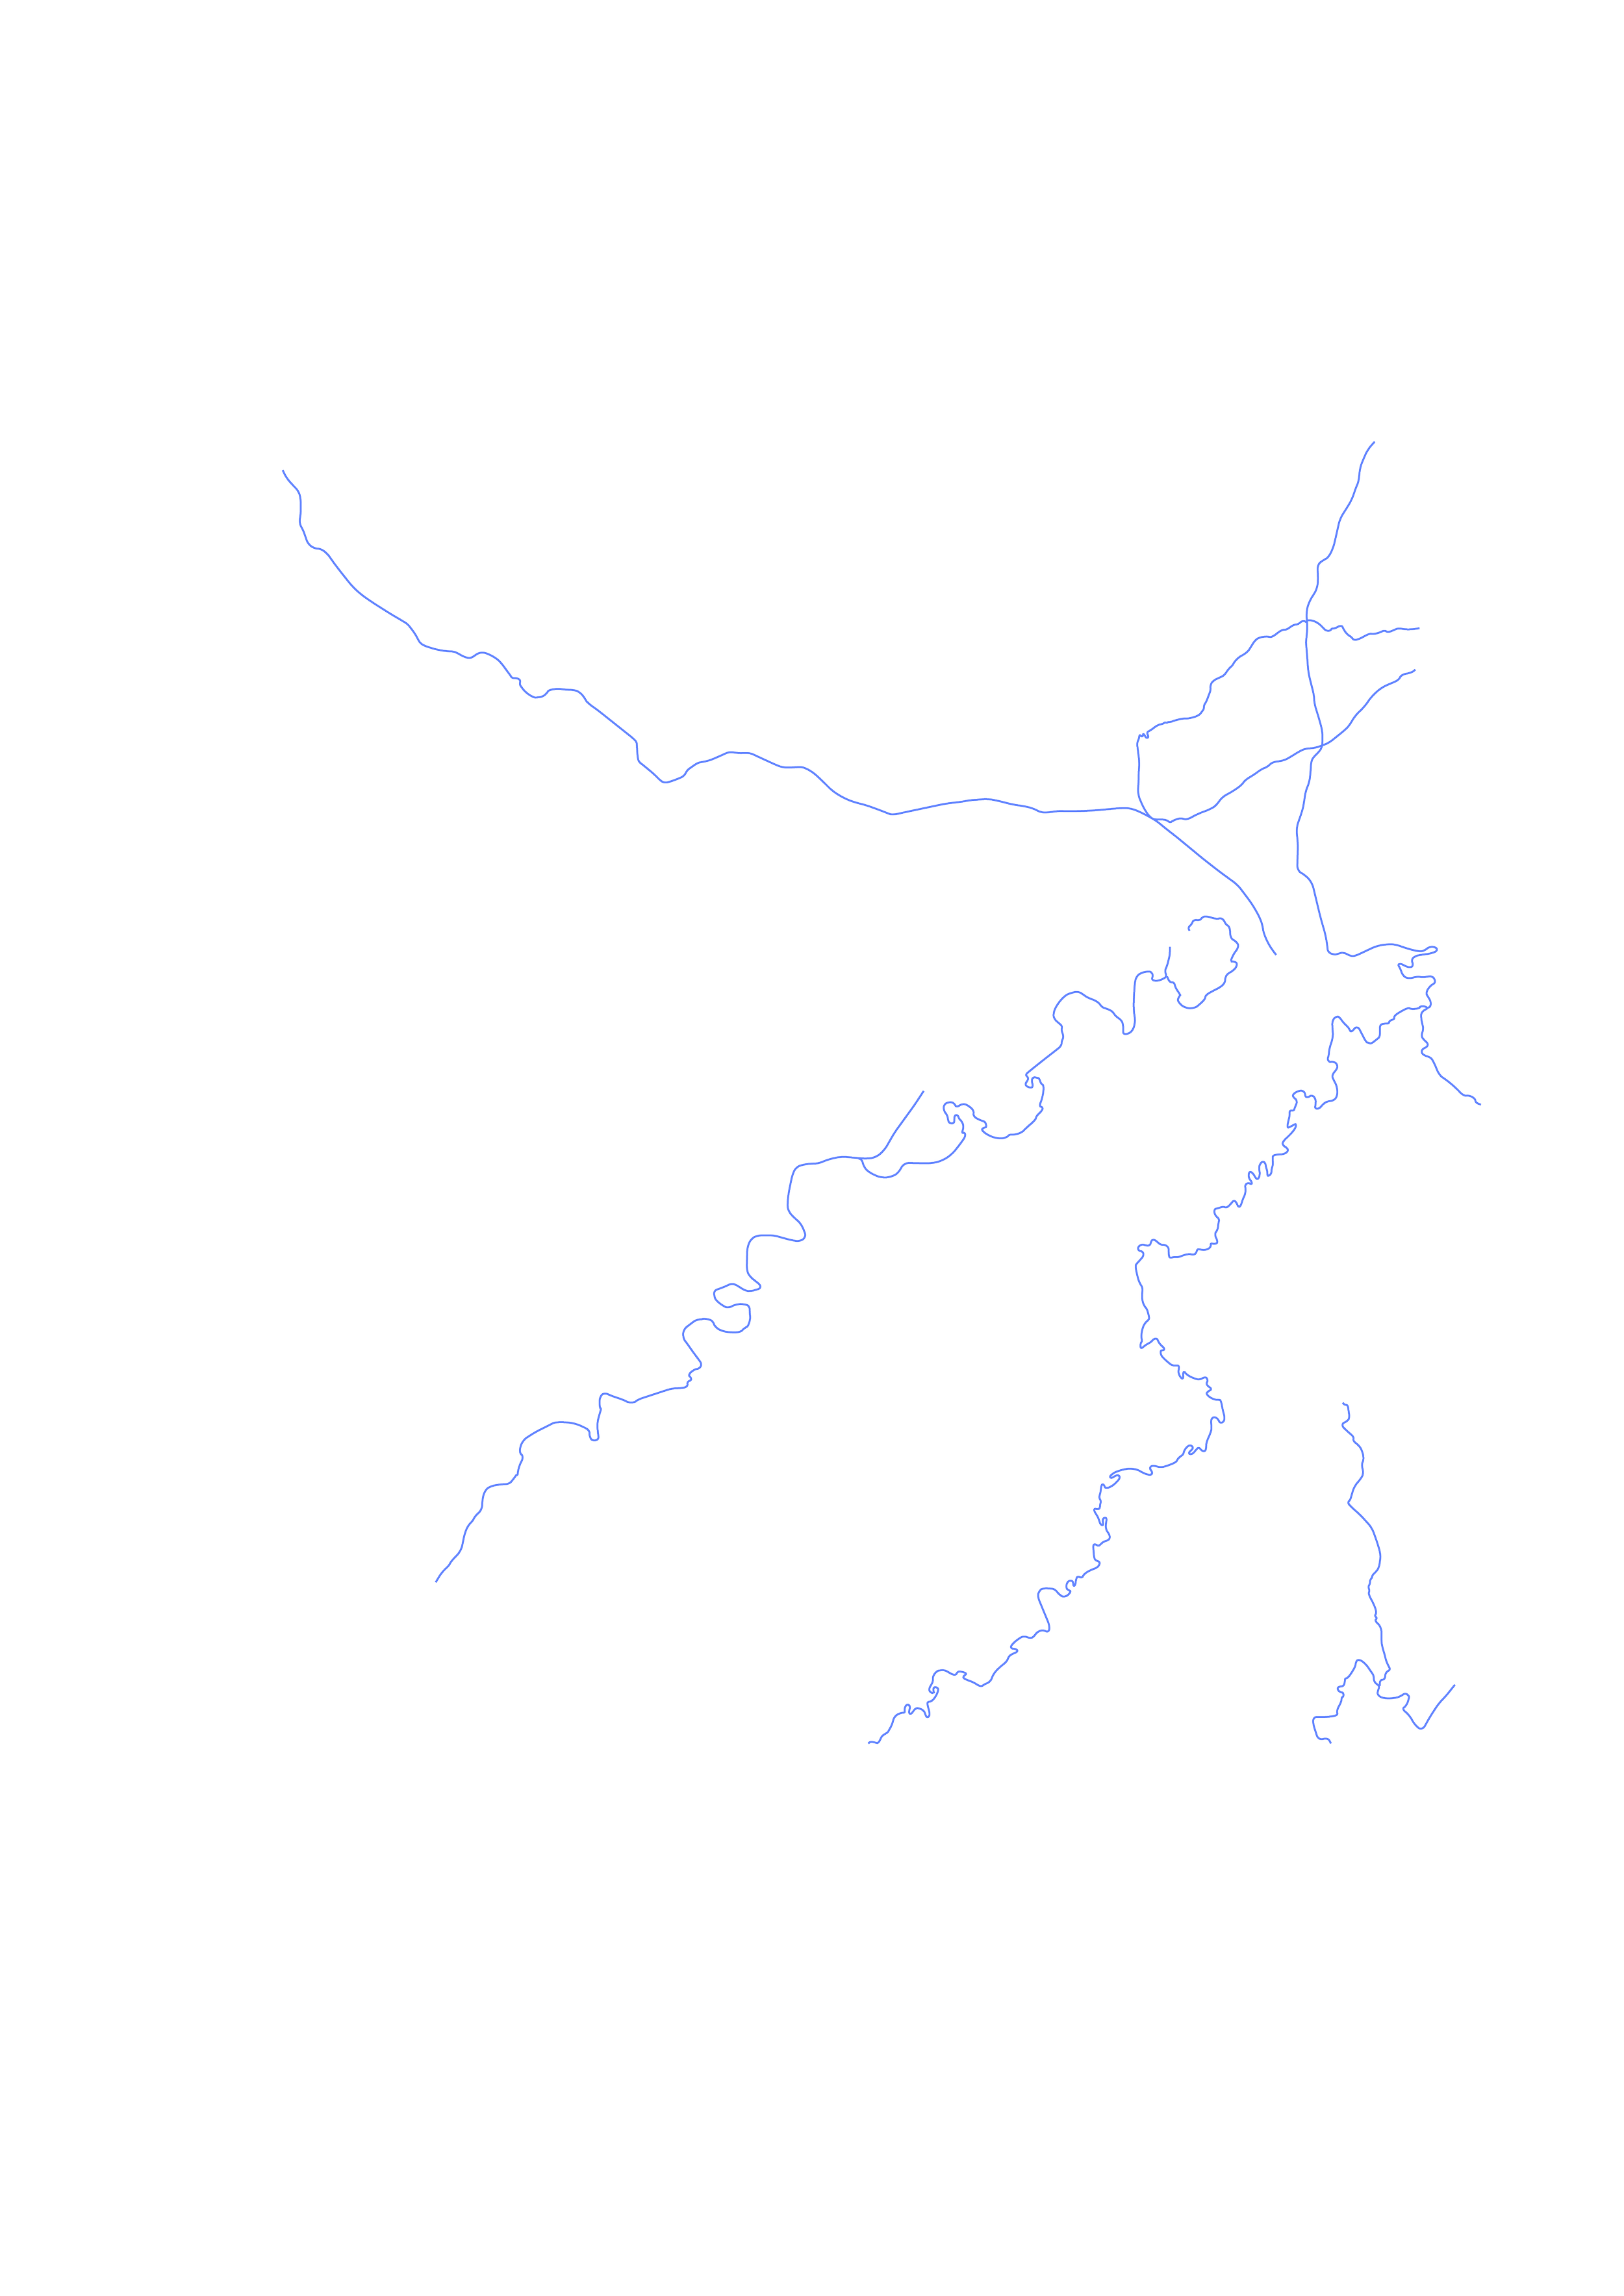
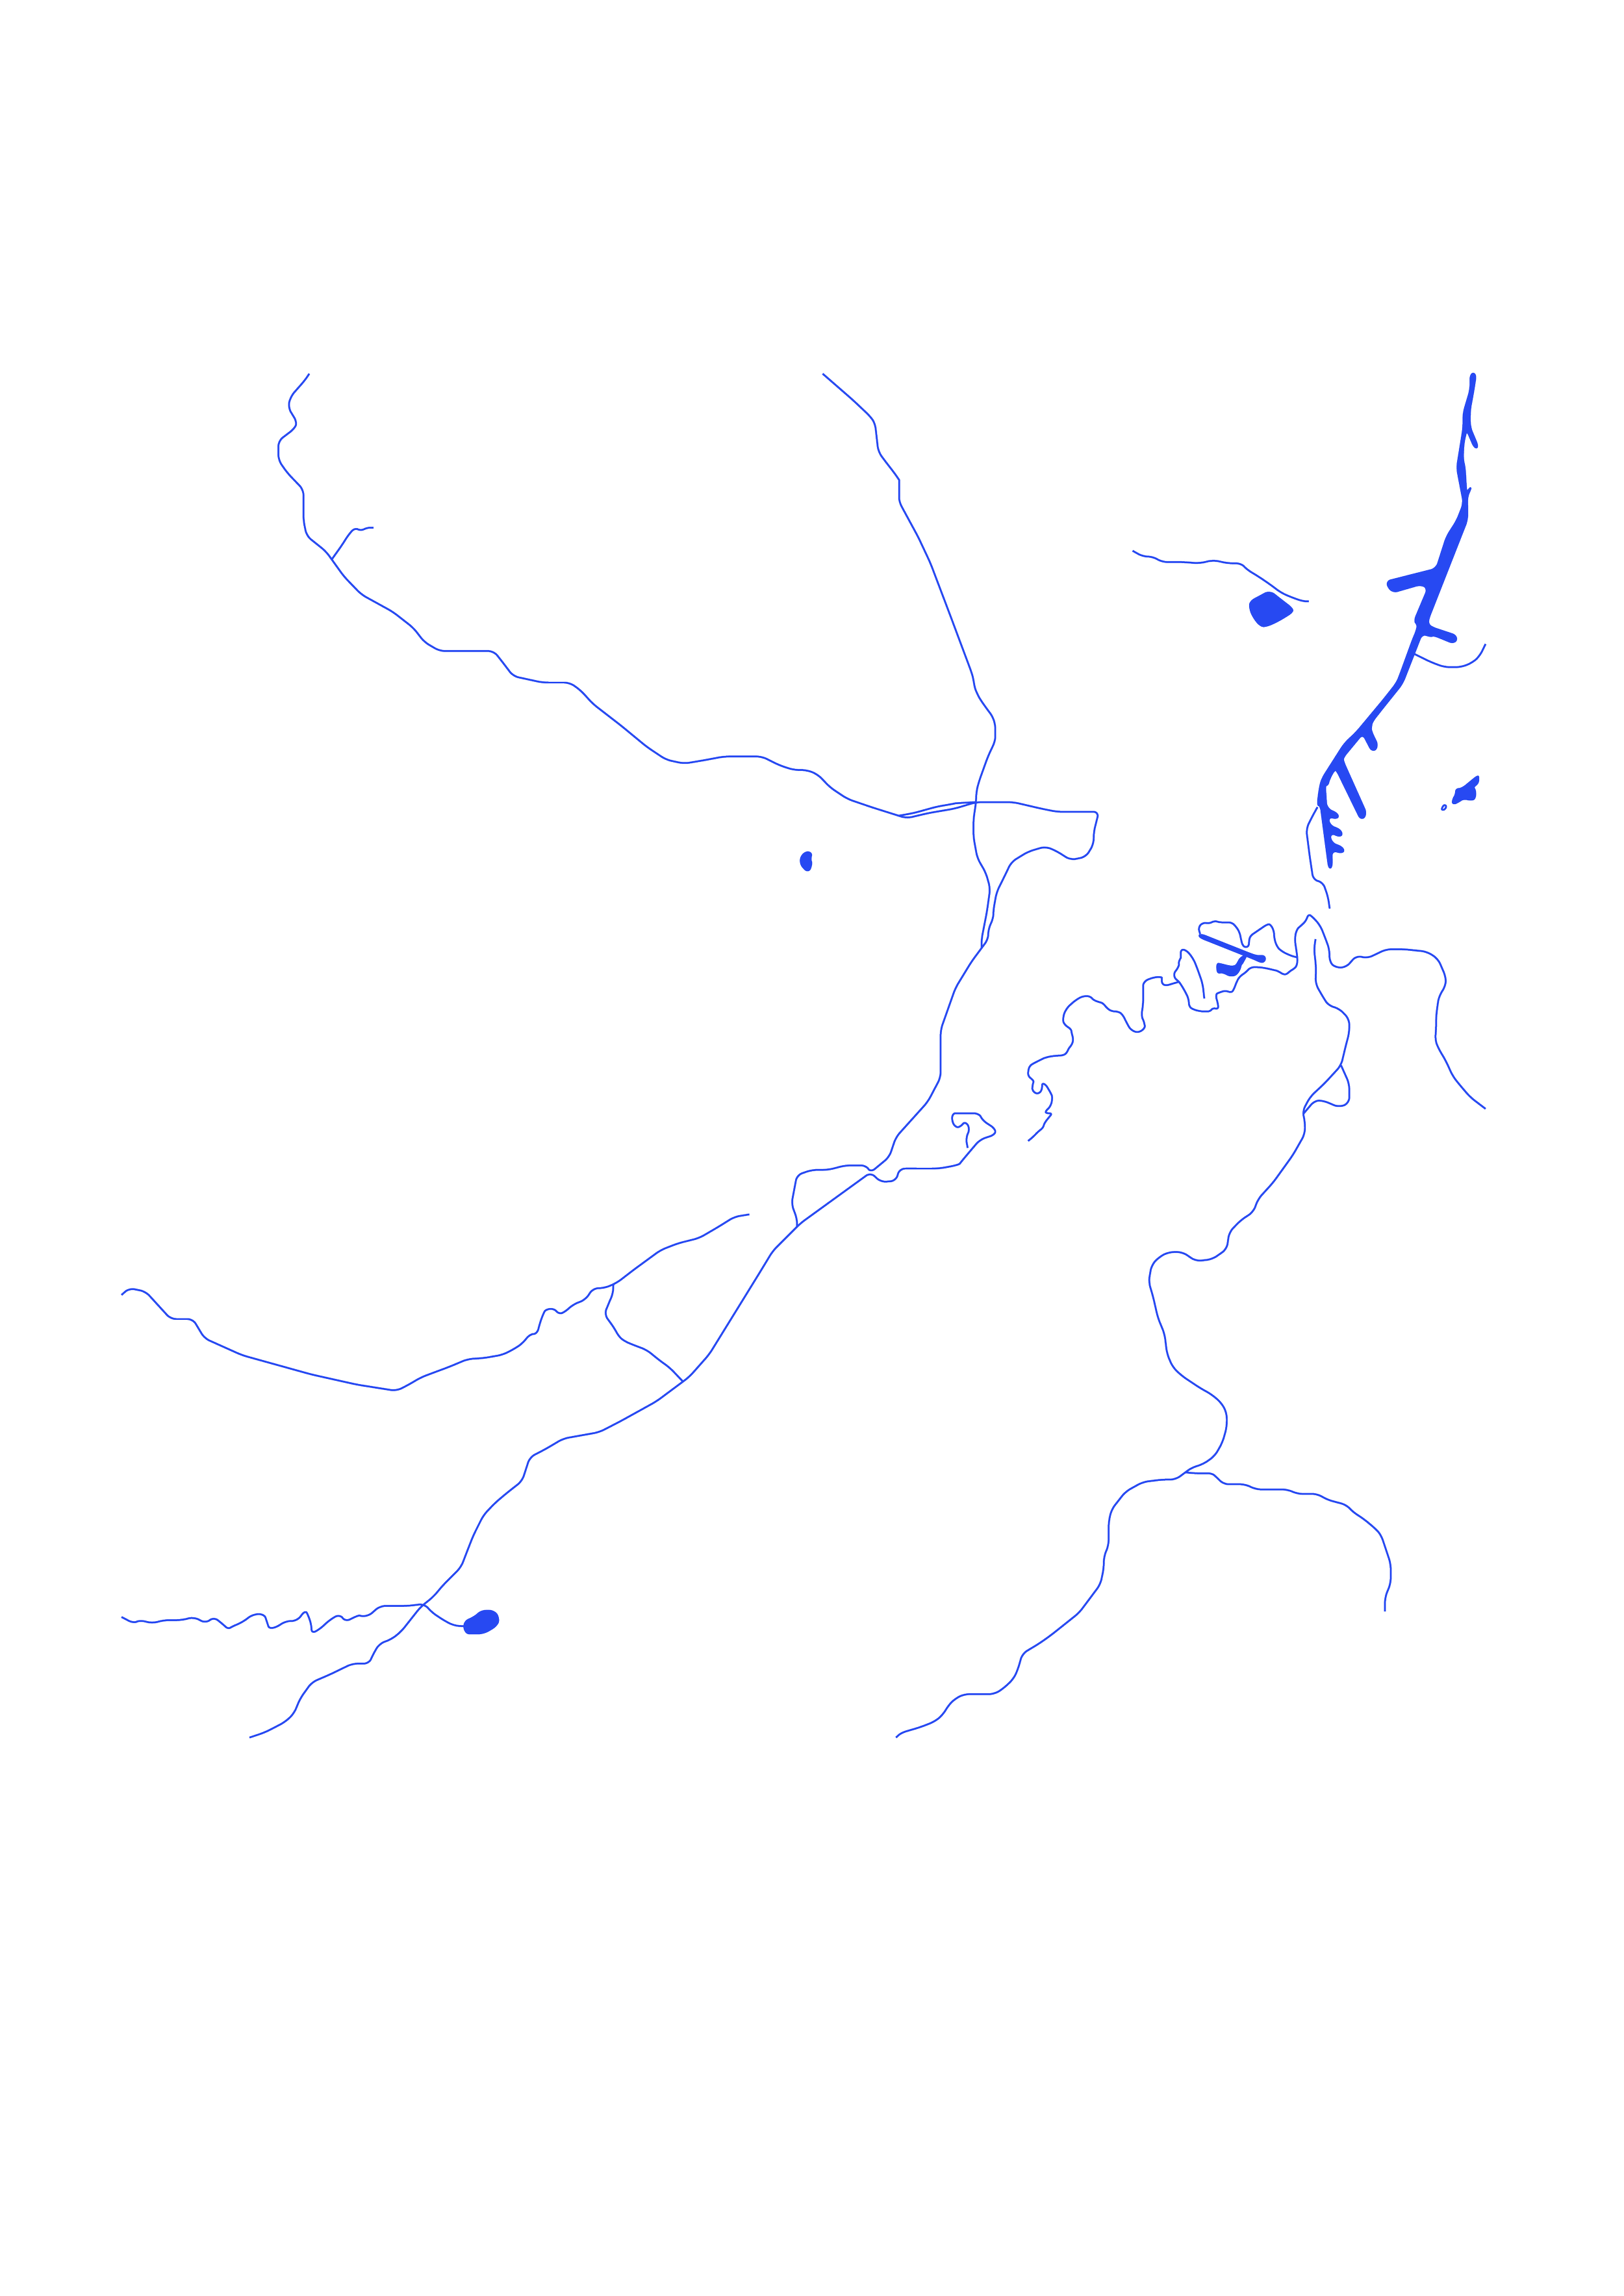
This river analysis displays the gradual and distinct shift of waterways in Flanders. The rivers have lost many of their curves and new, man made reservoirs increase water supply to certain districts, and restrain it for others.
Settlements
-
1777
-

1846
-

2019
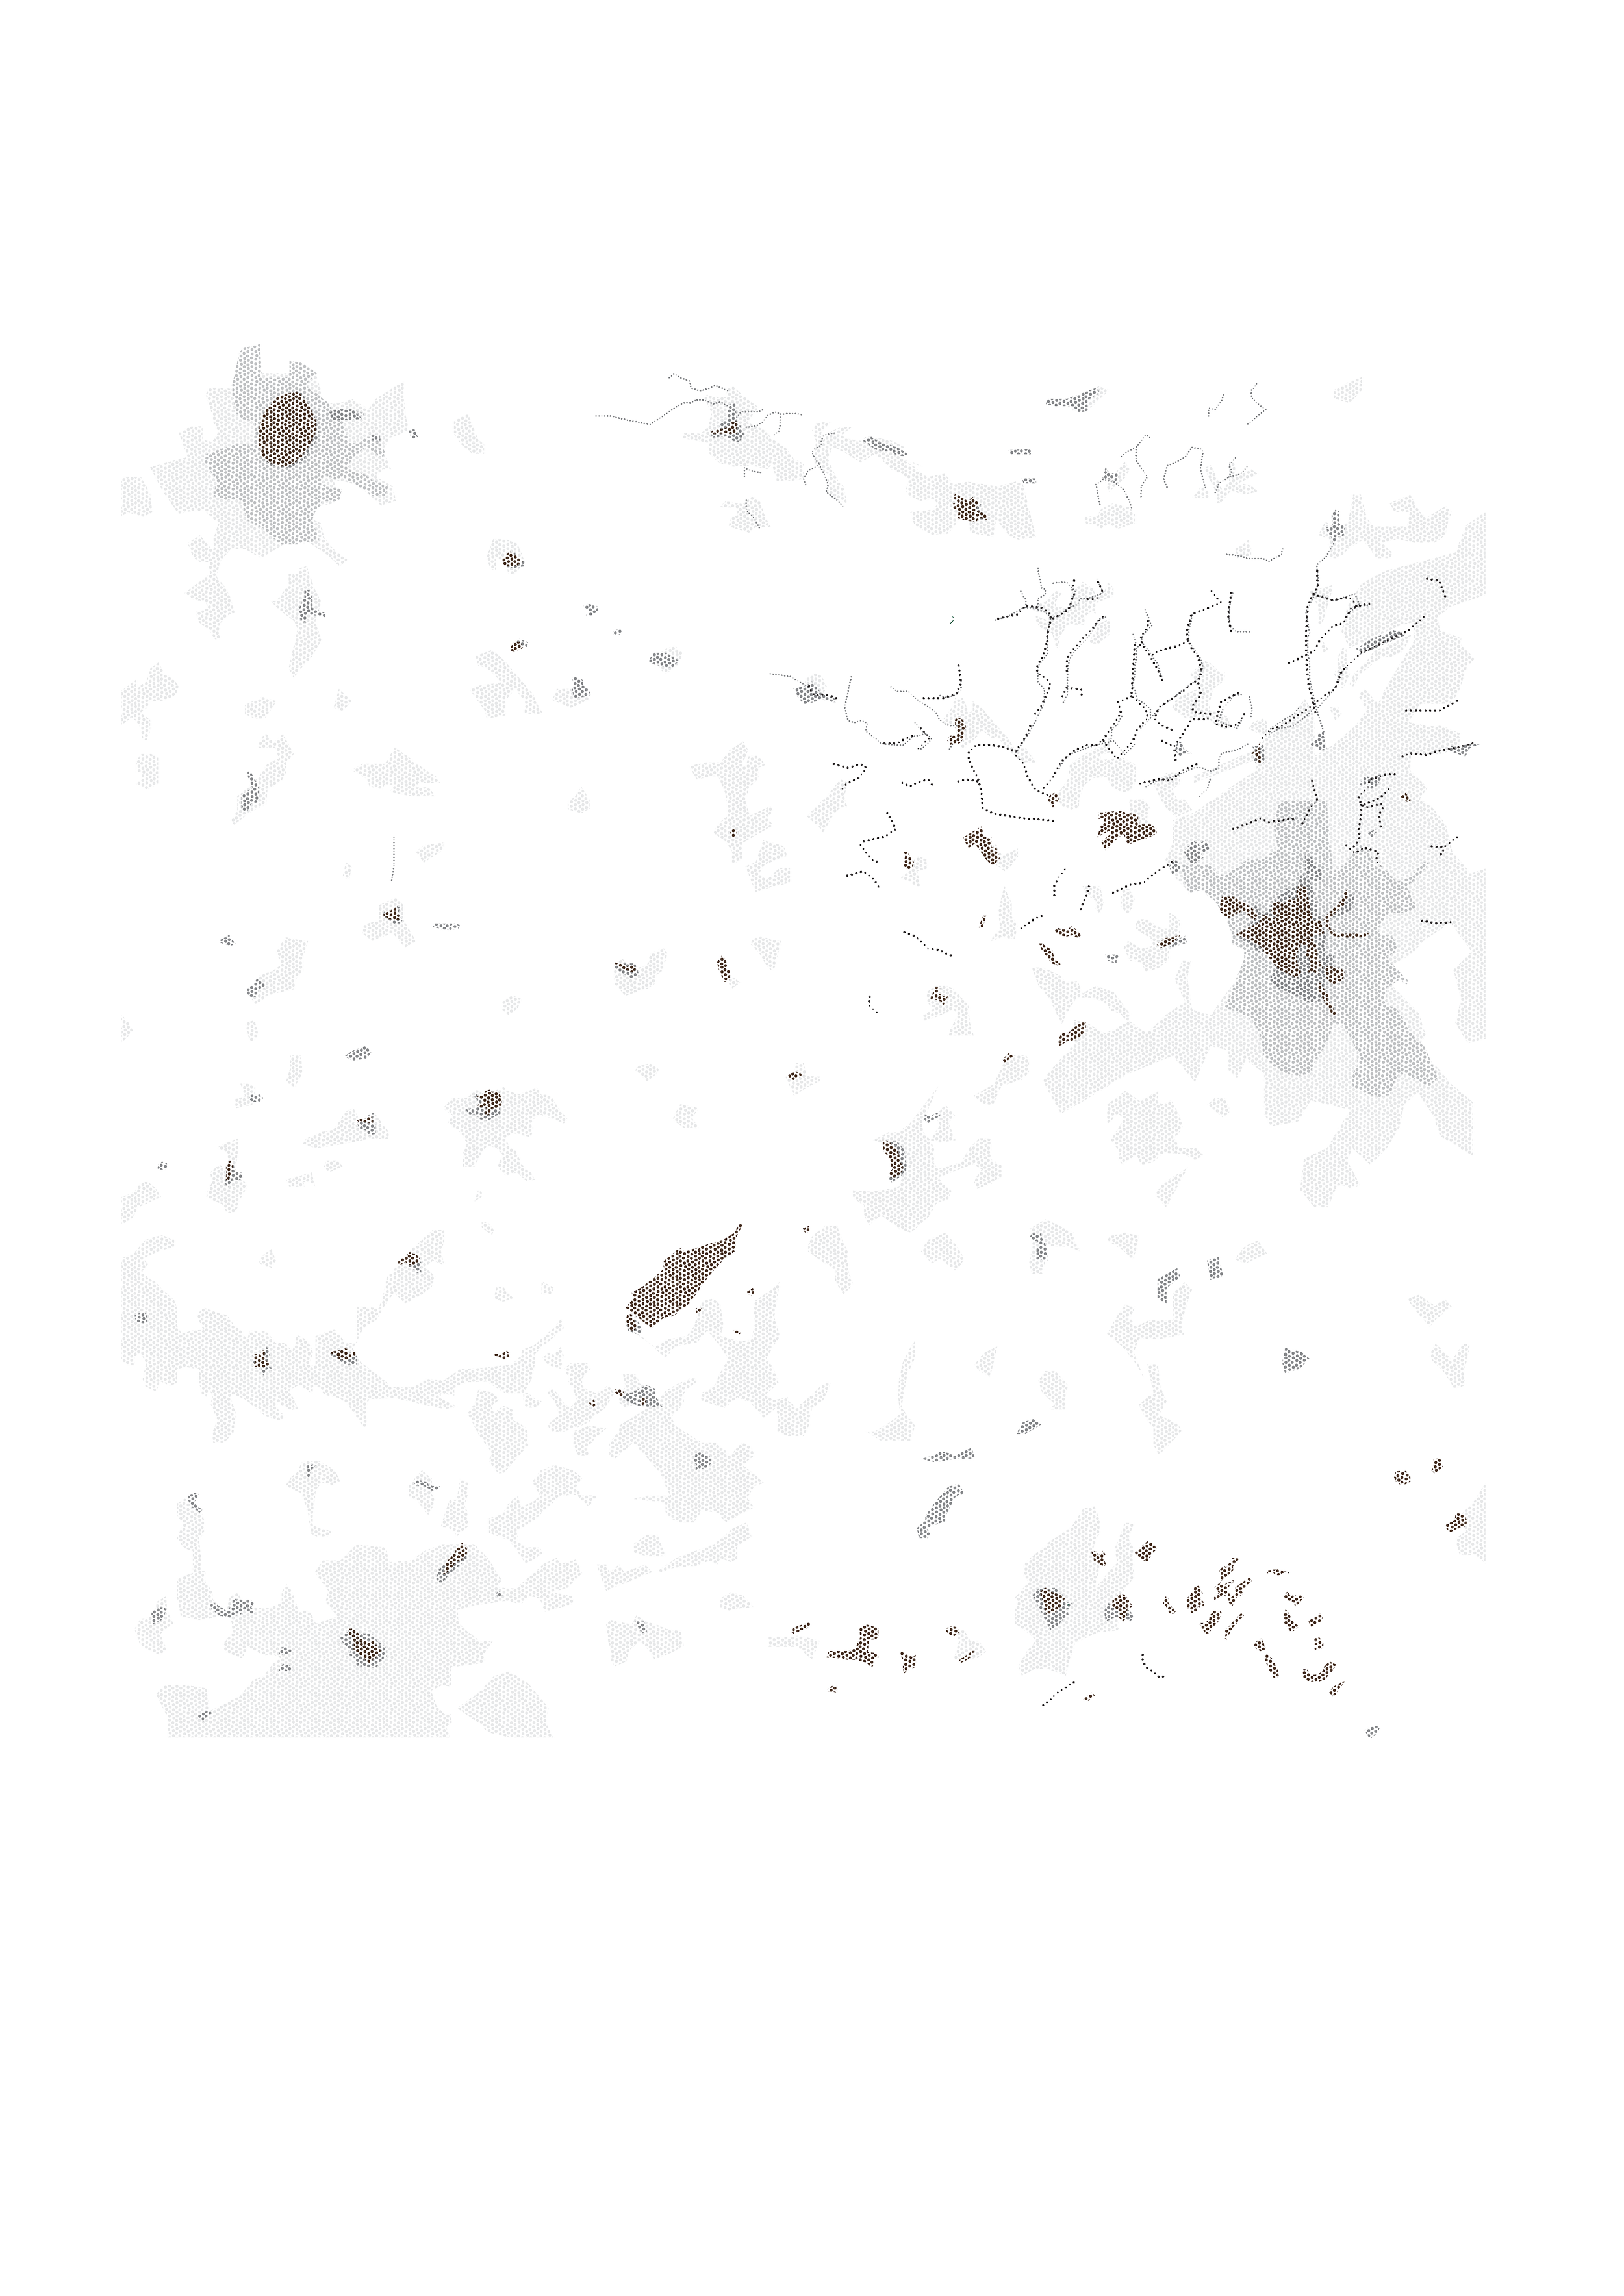
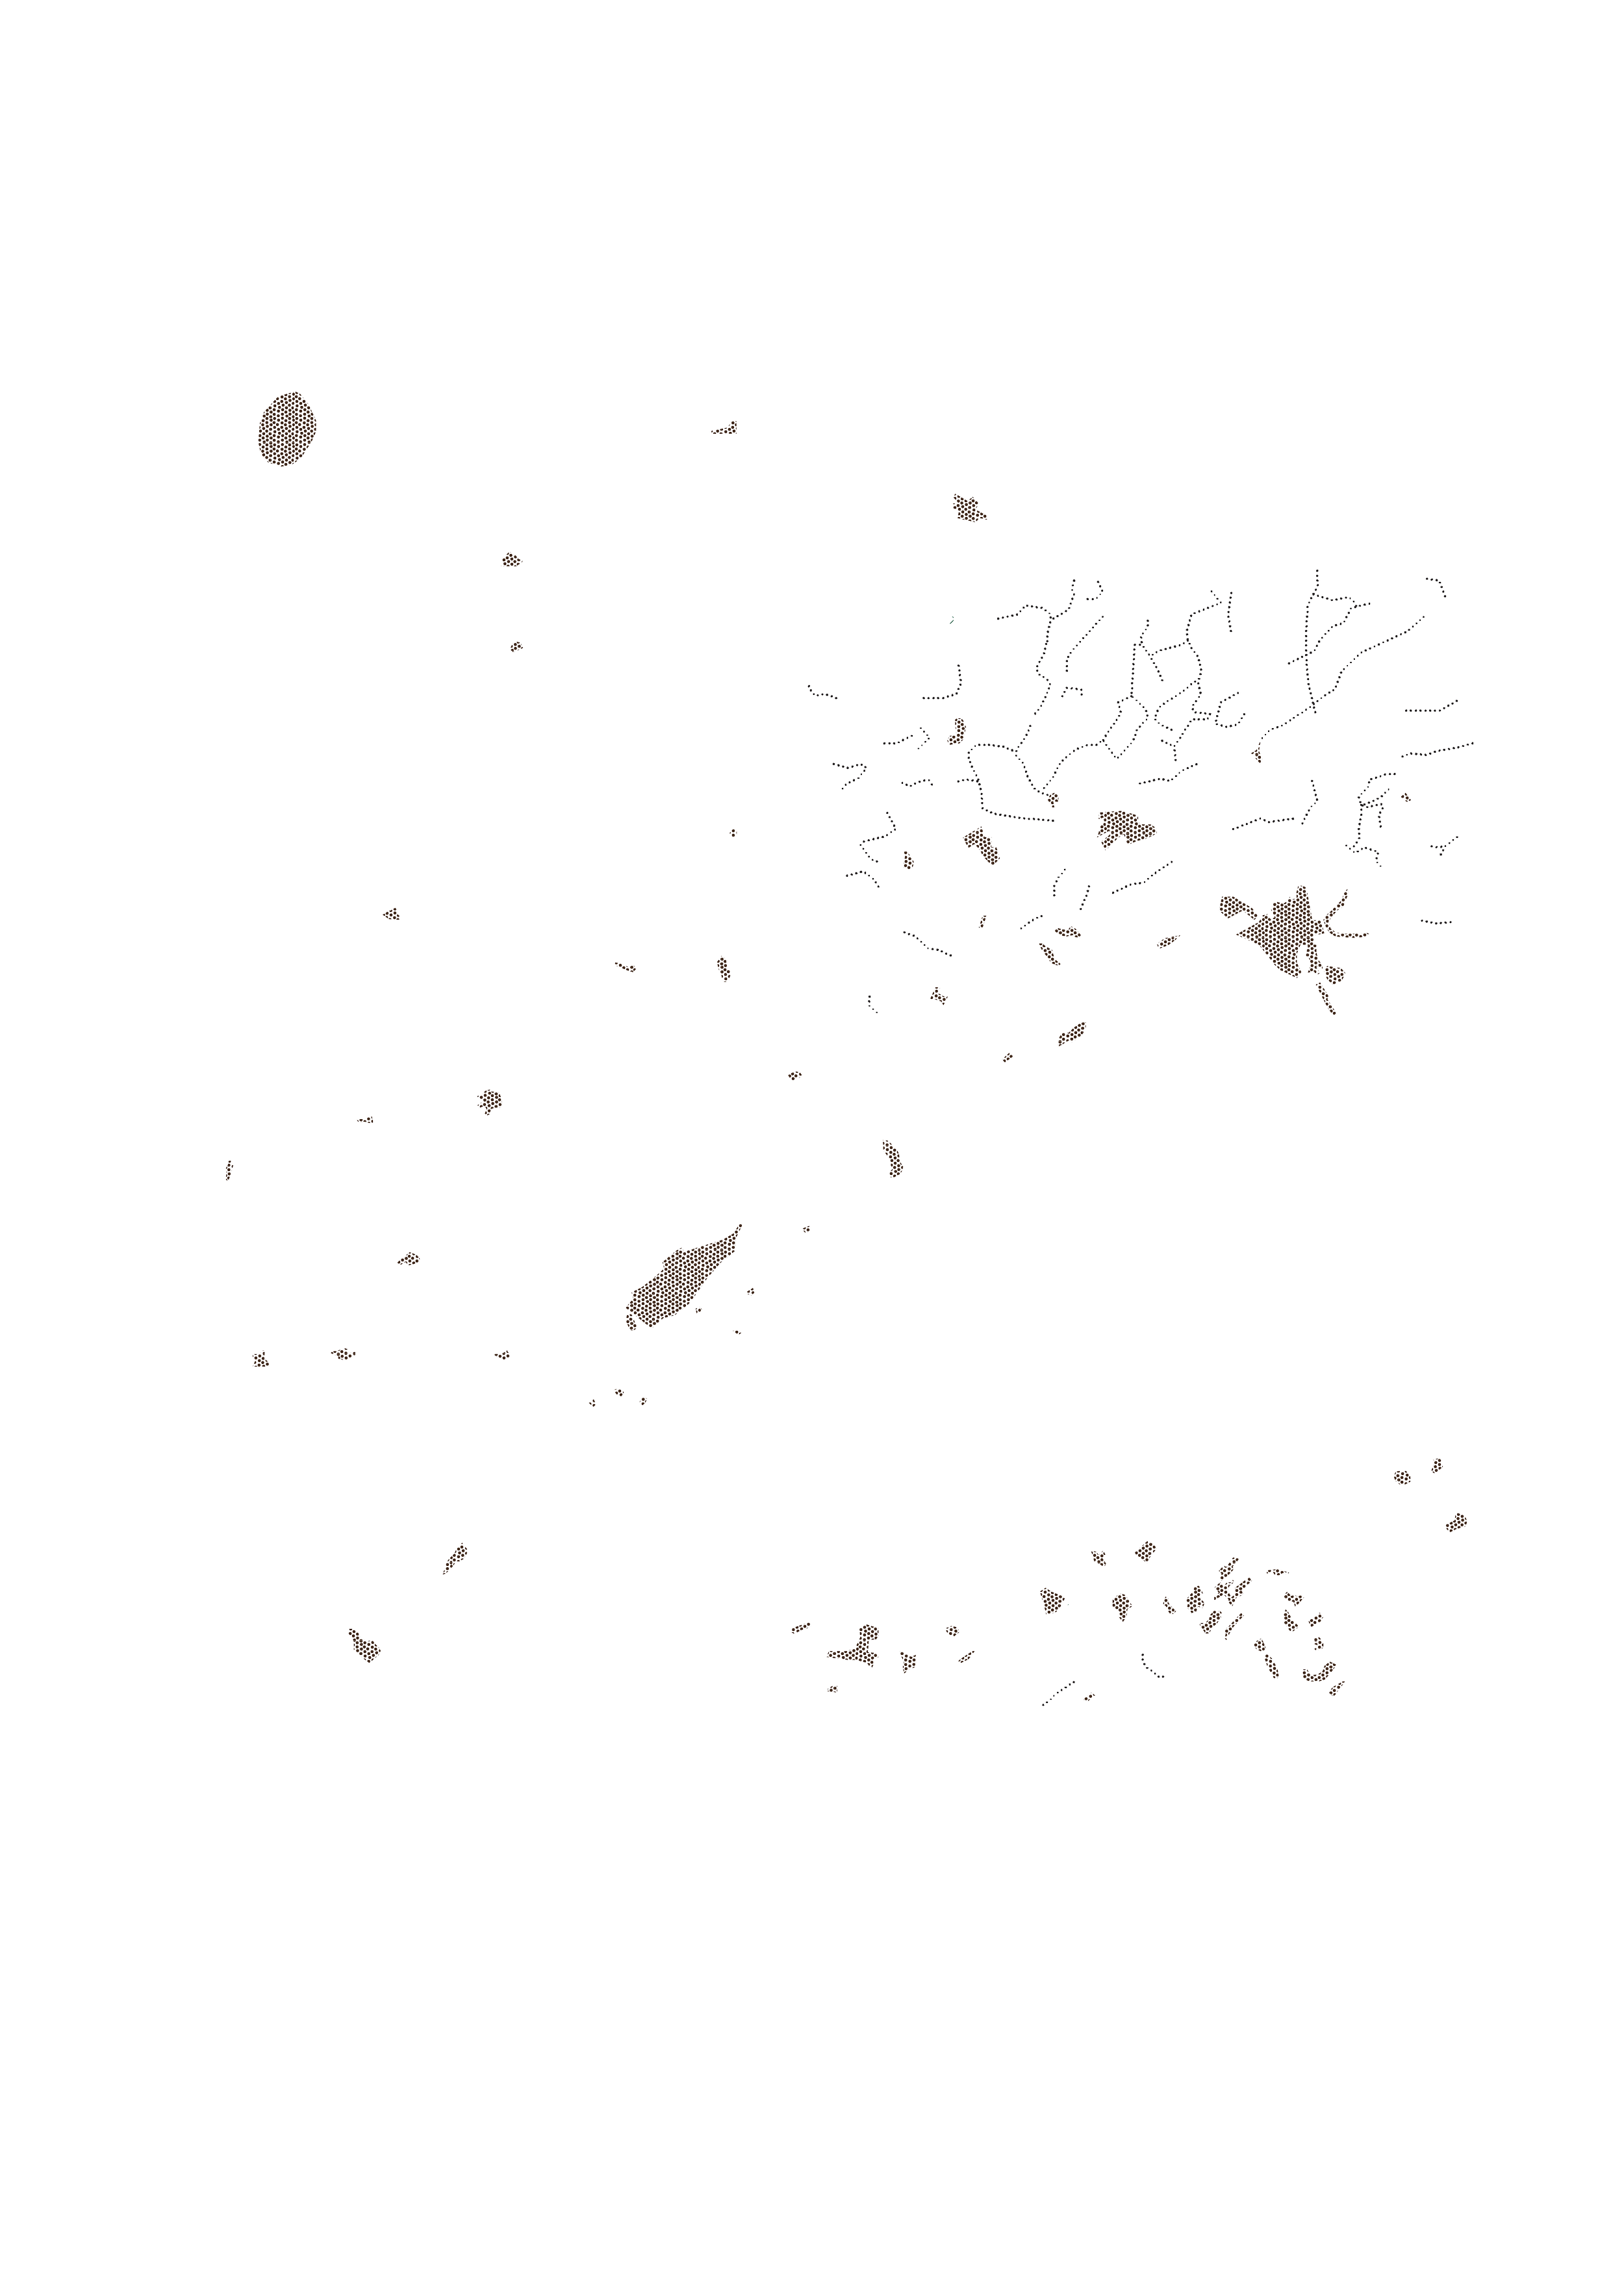
This river analysis displays the gradual and distinct shift of waterways in Flanders. The rivers have lost many of their curves and new, man made reservoirs increase water supply to certain districts, and restrain it for others.
Green Space
-
1777
-
1846
-
2019
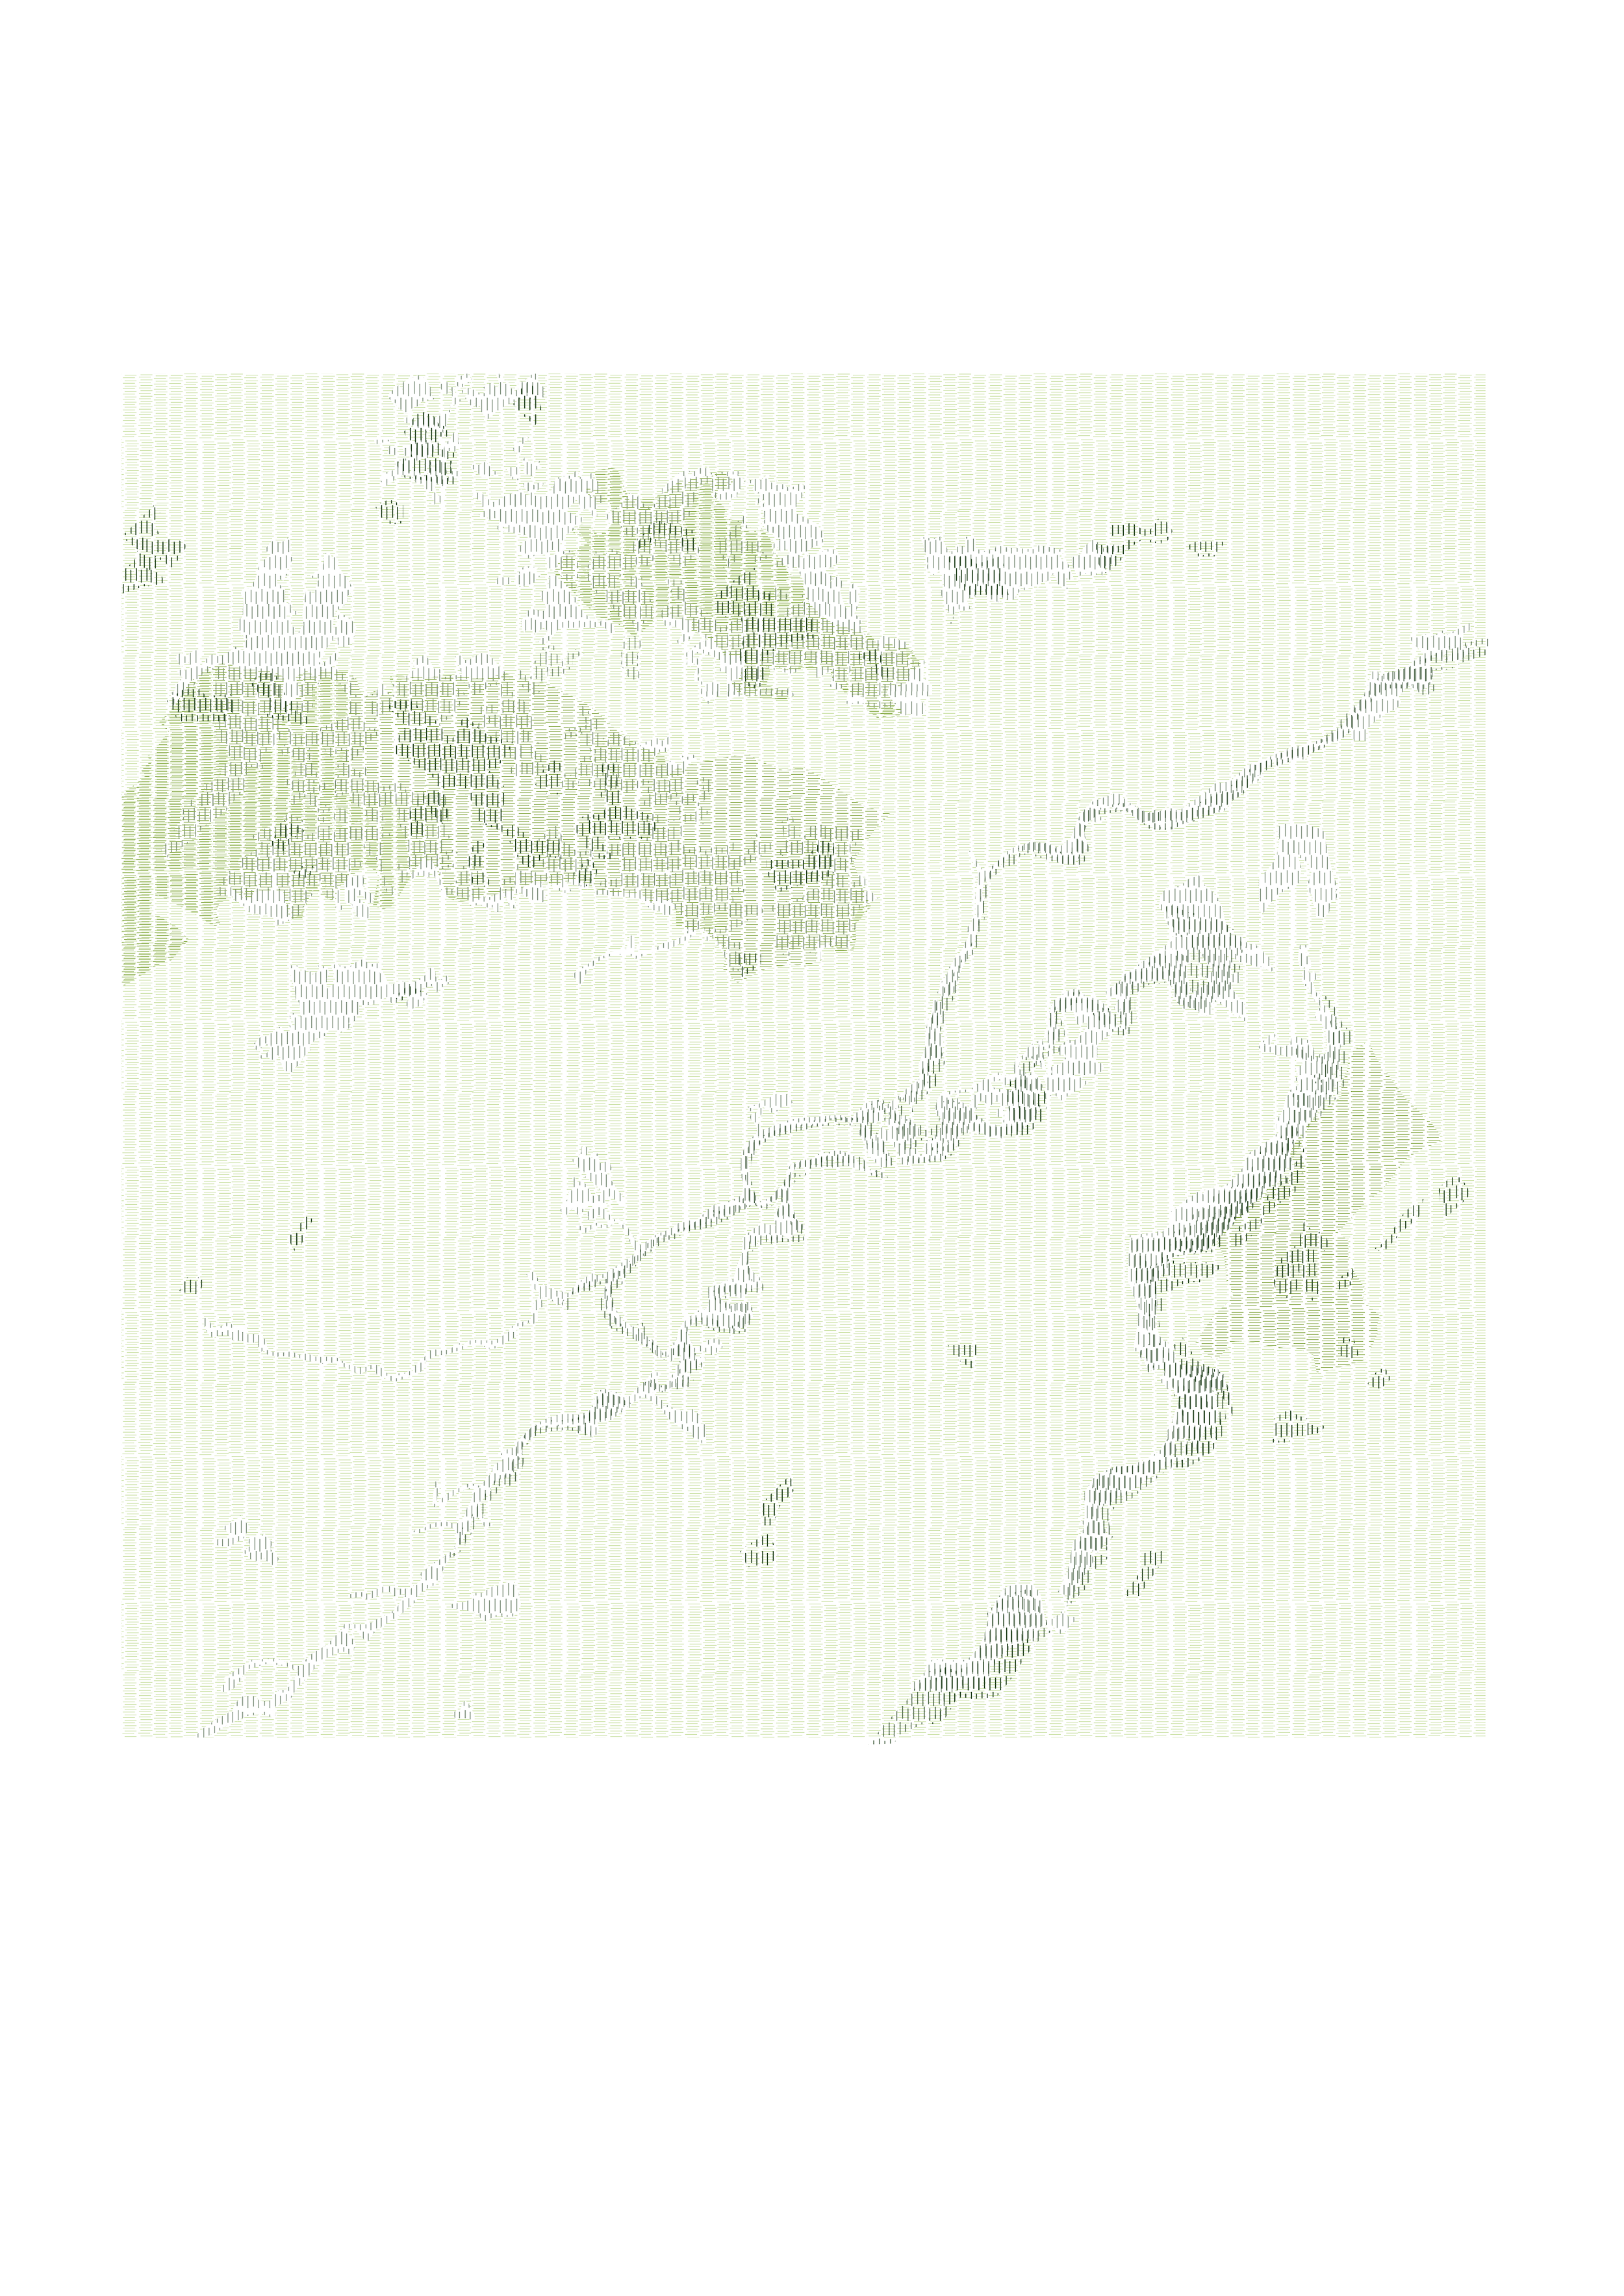
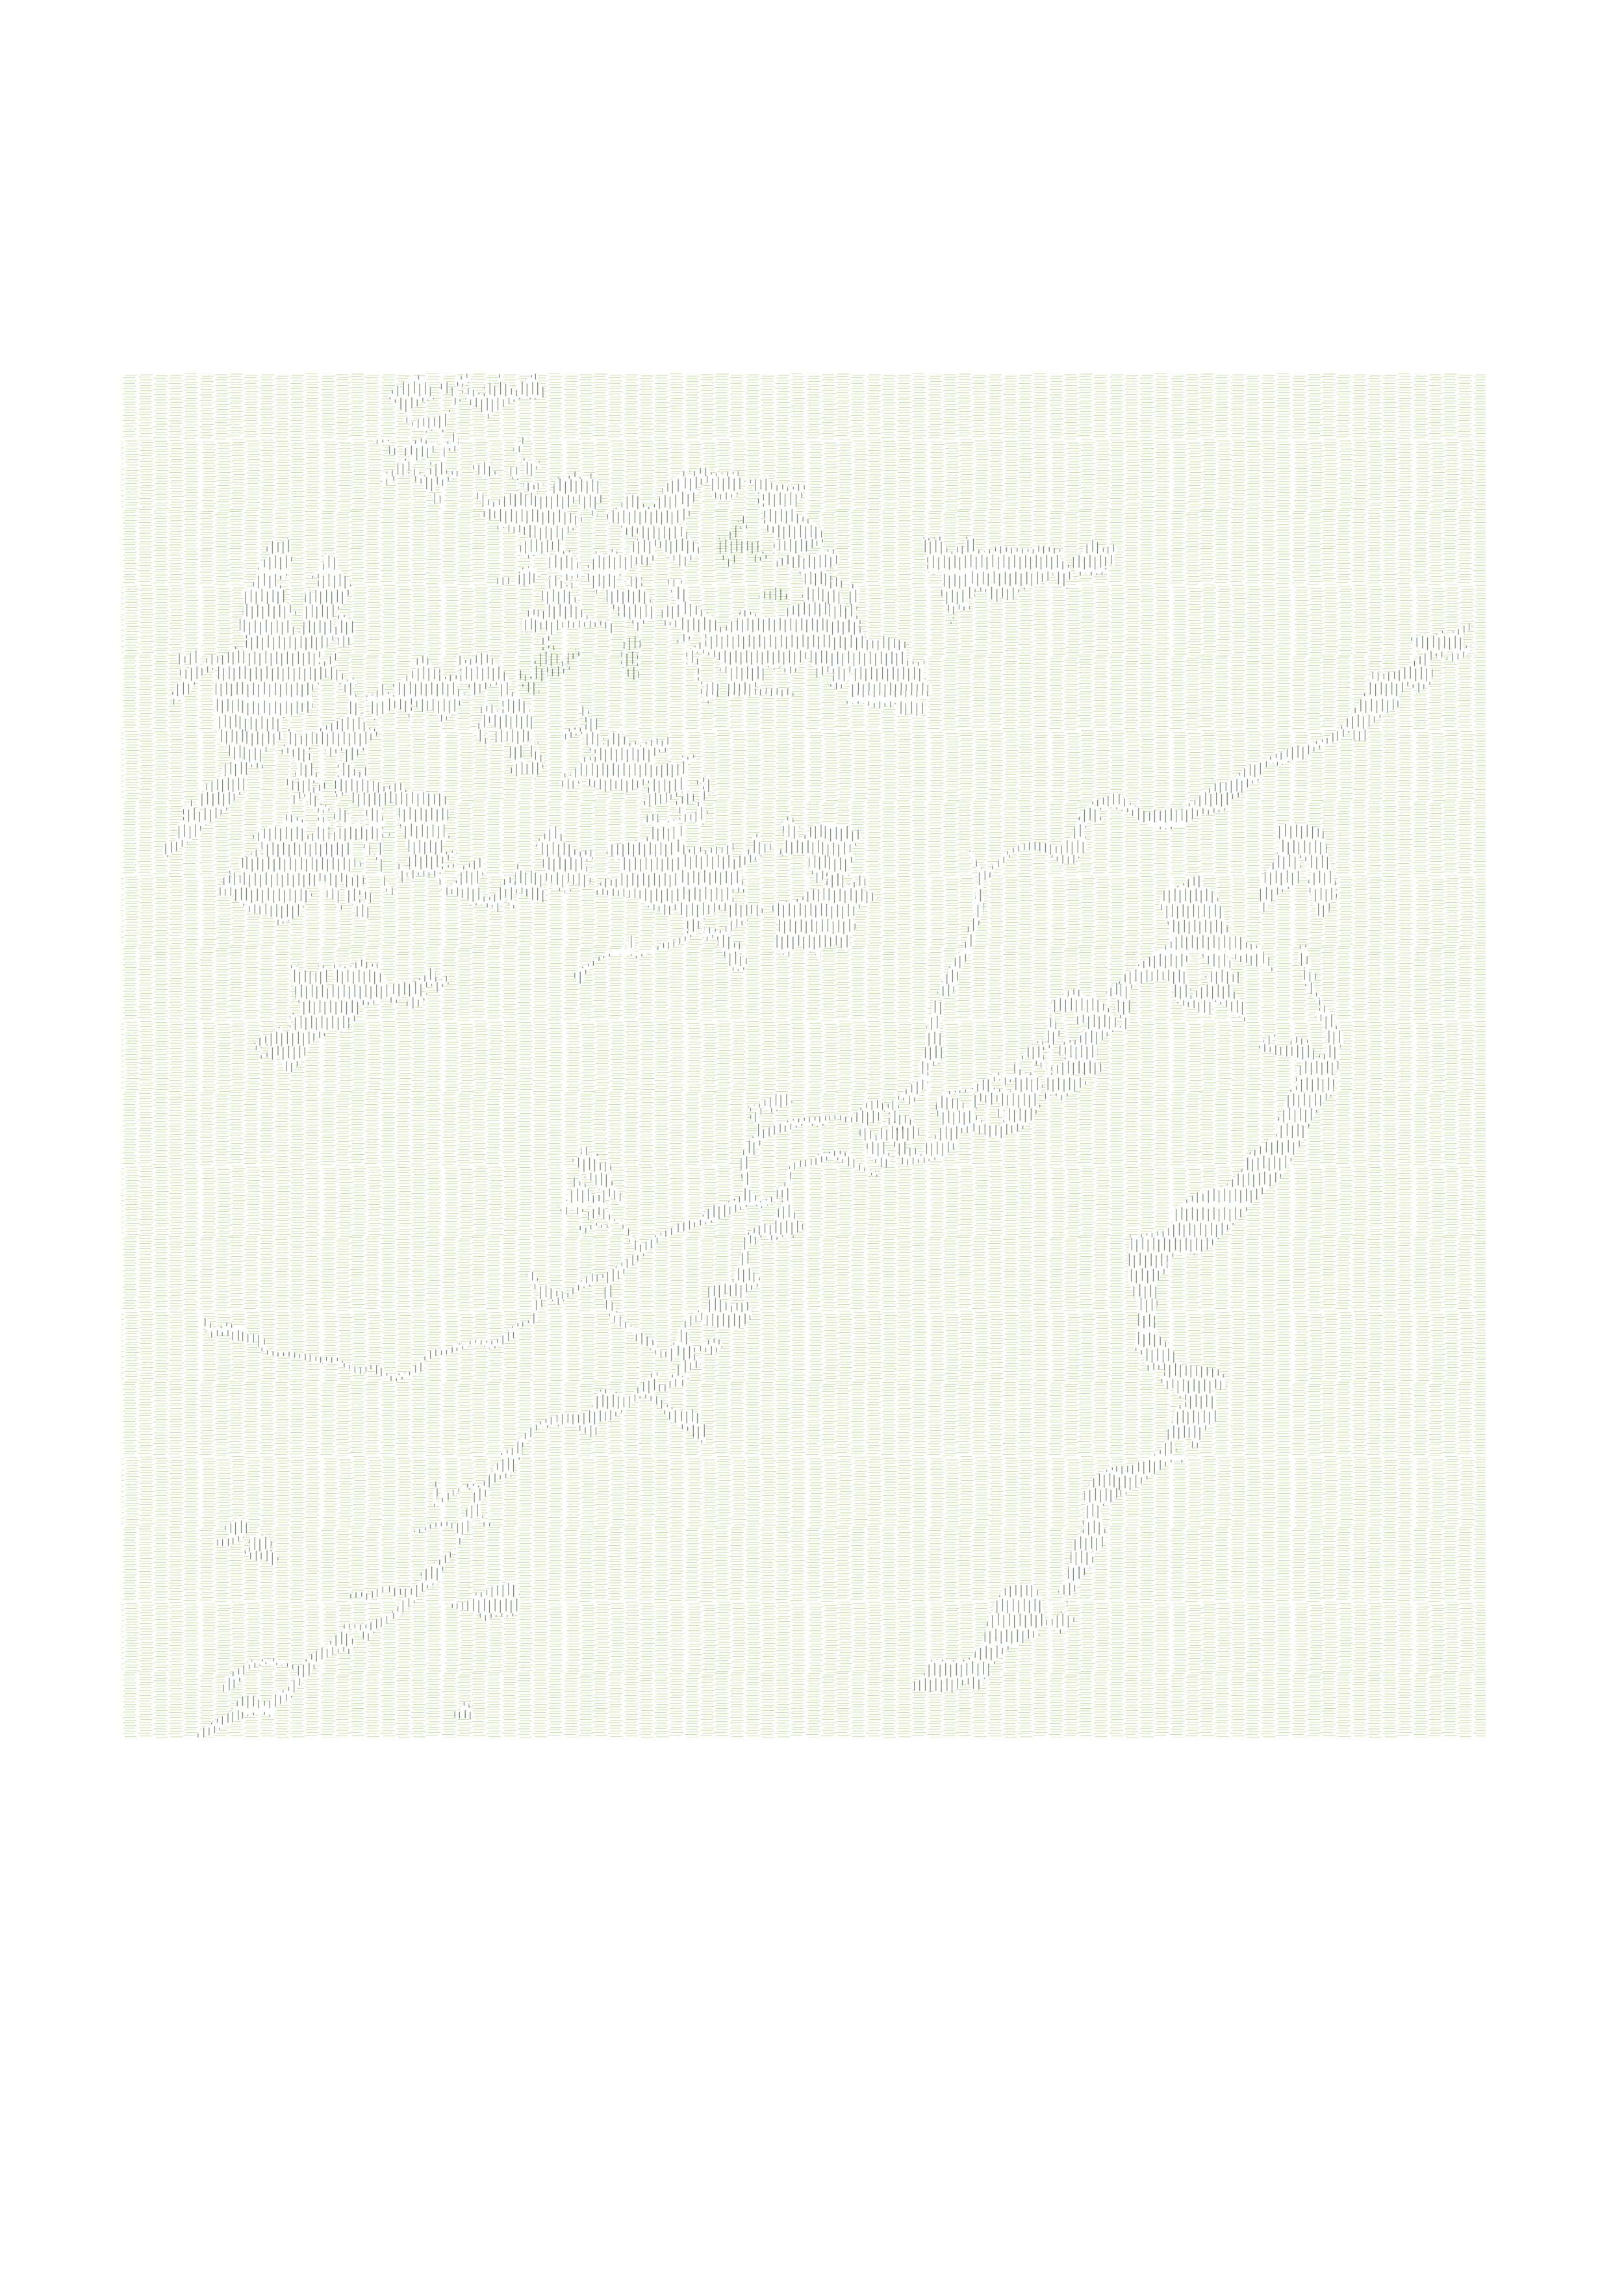
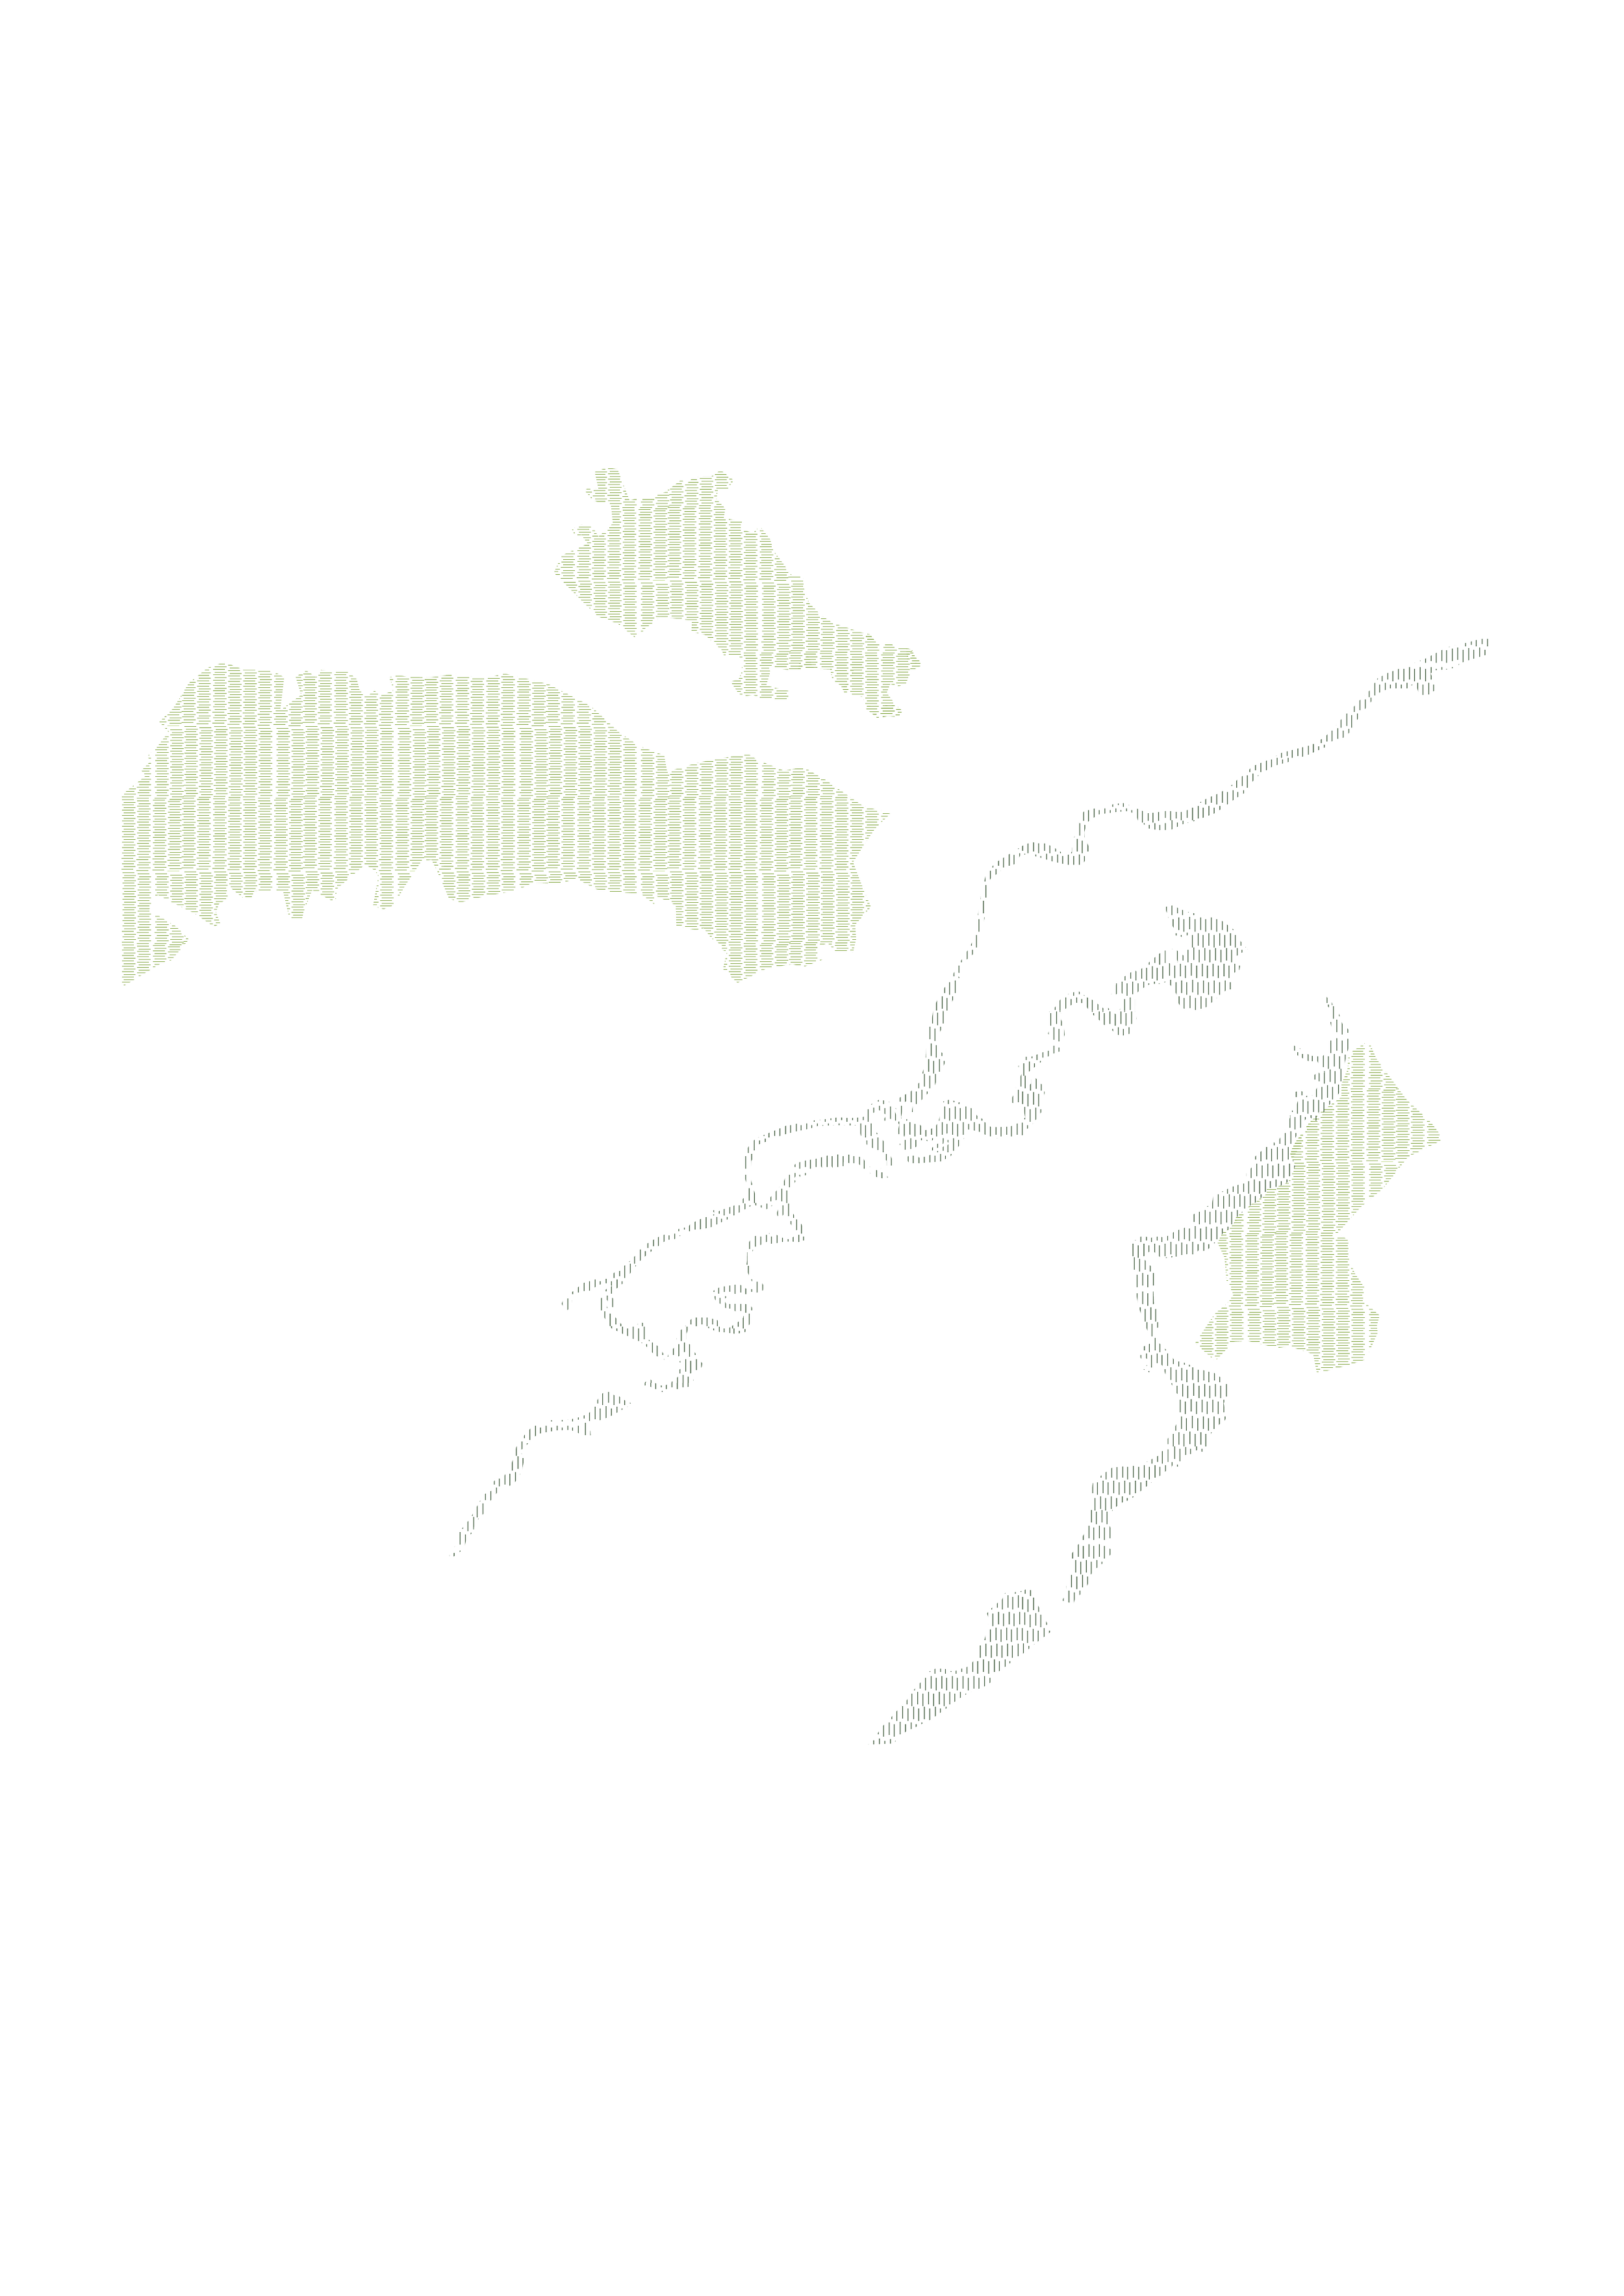
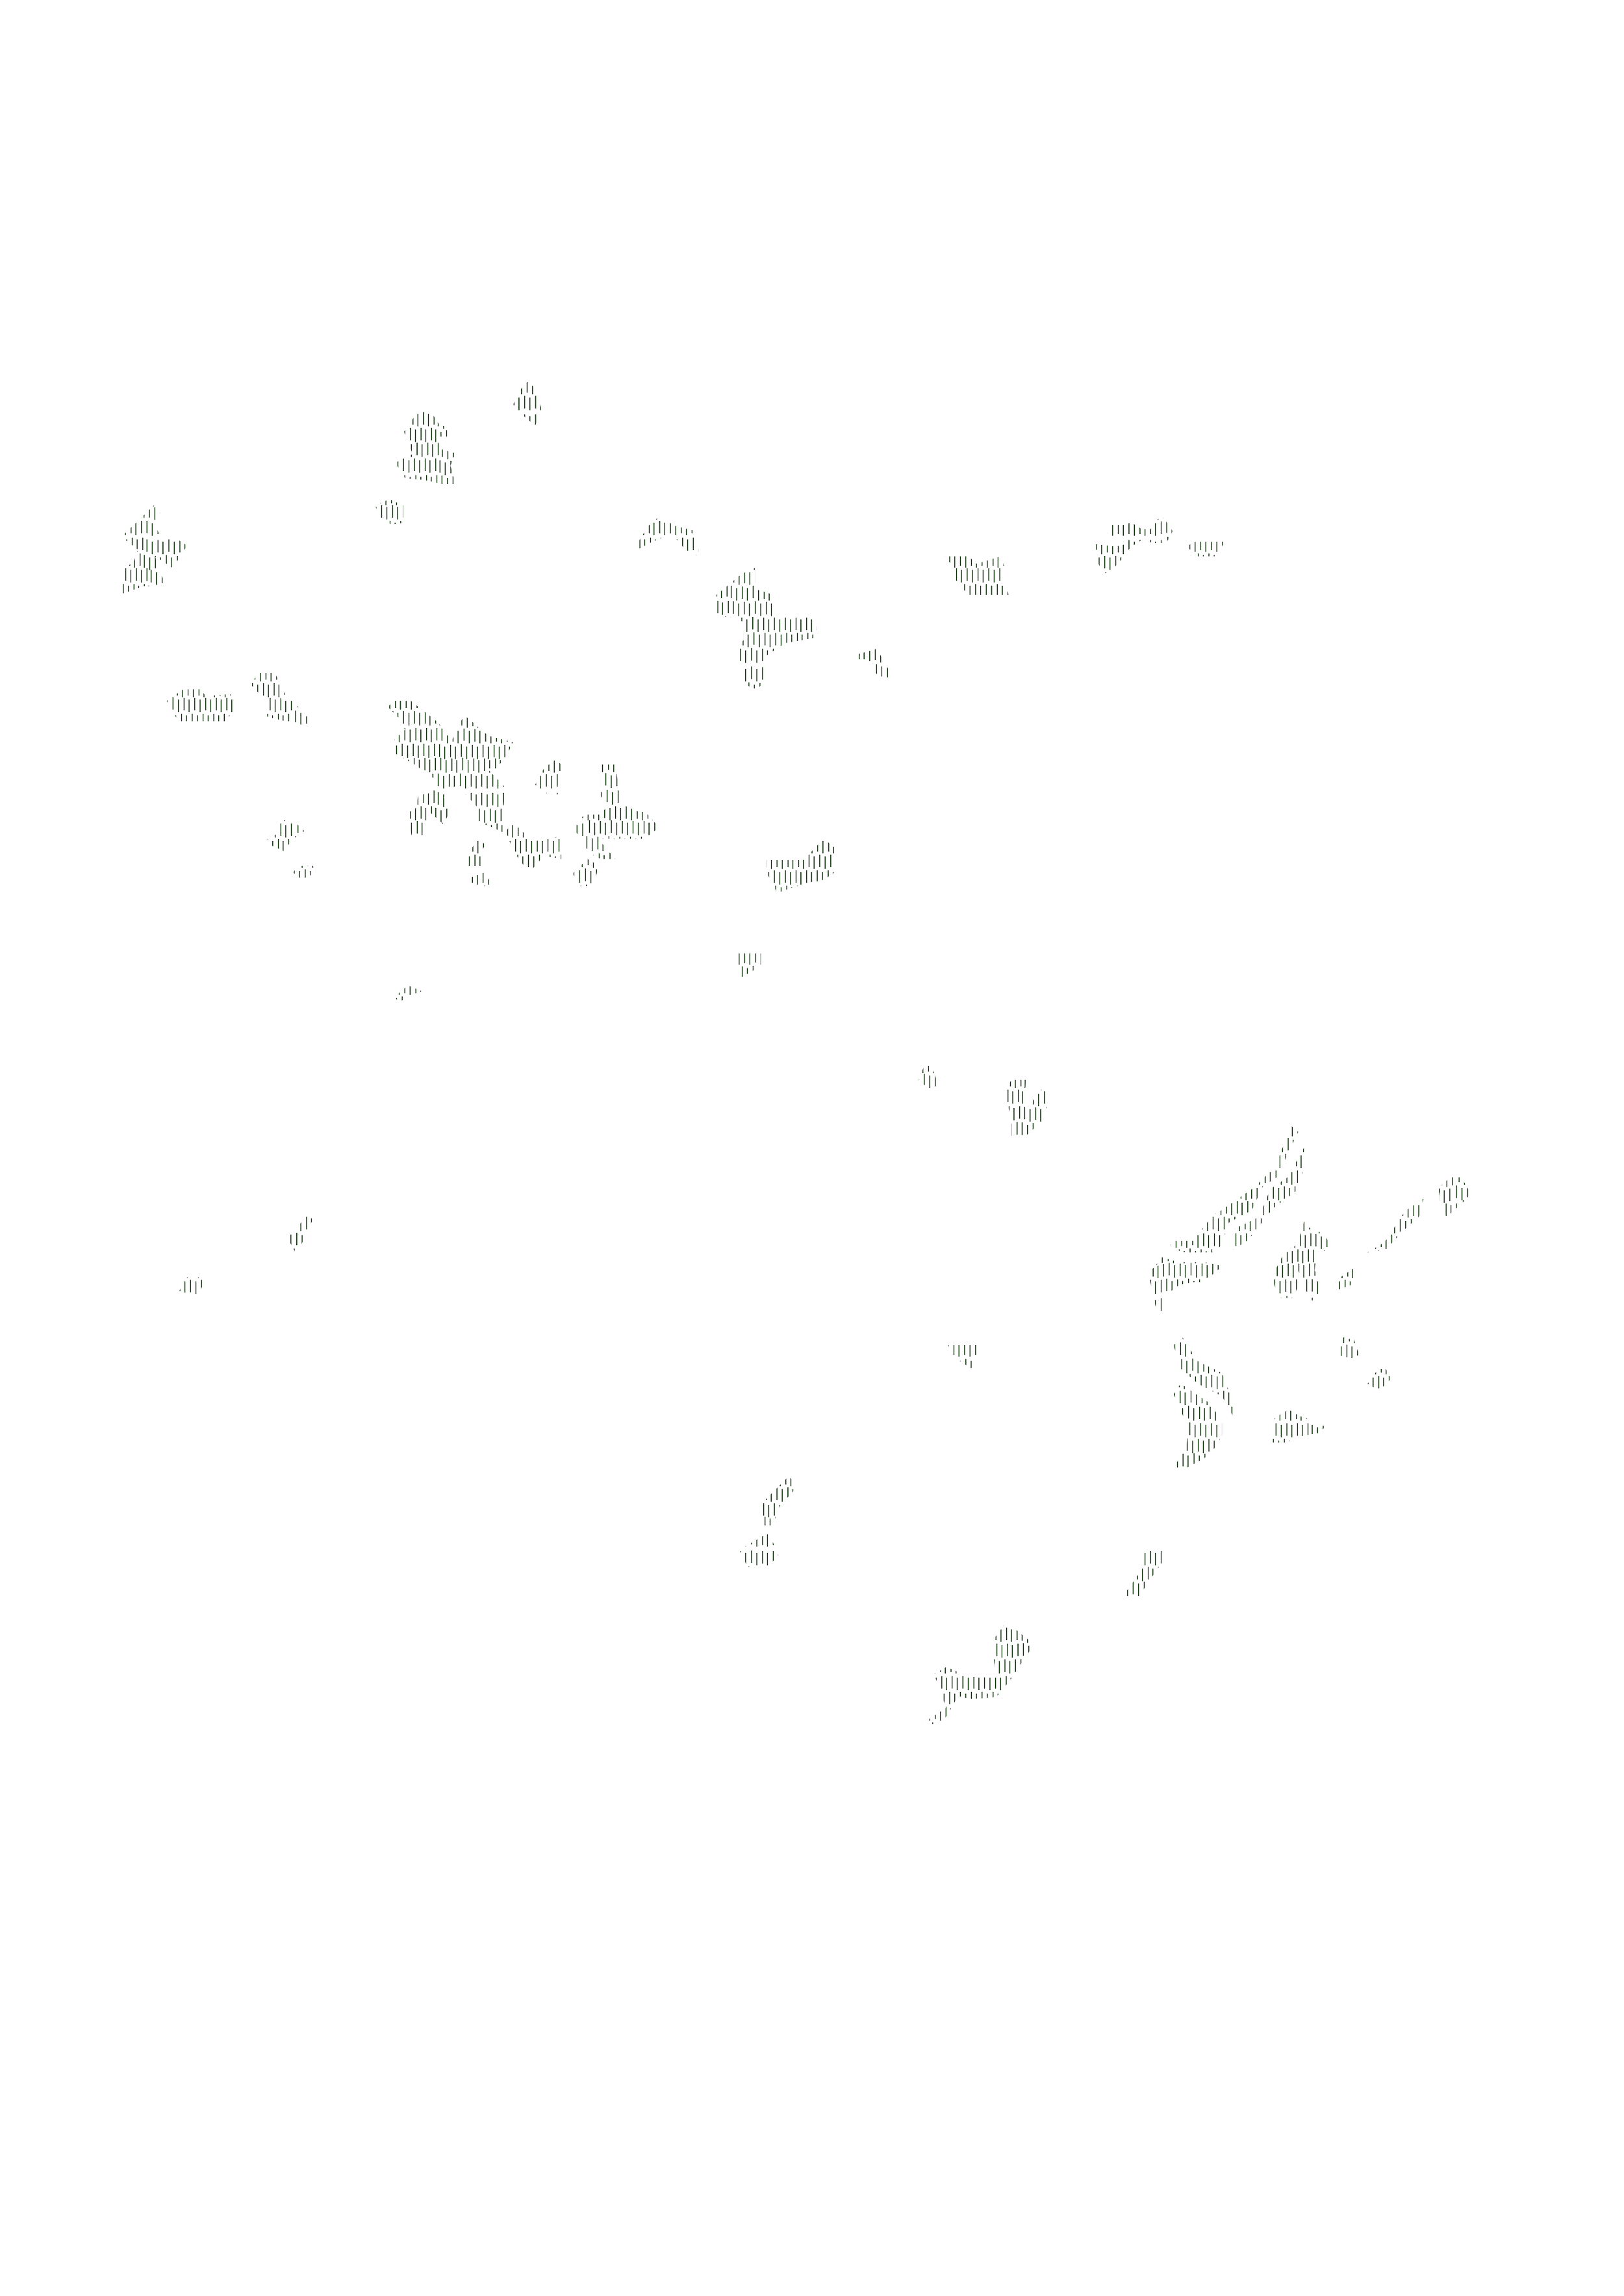
This map illustrates the rapid reduction of natural green spaces in Flanders. One can observe narrow corridors forming between urban hubs in the region.
Mobility
-
1777
-
1846
-
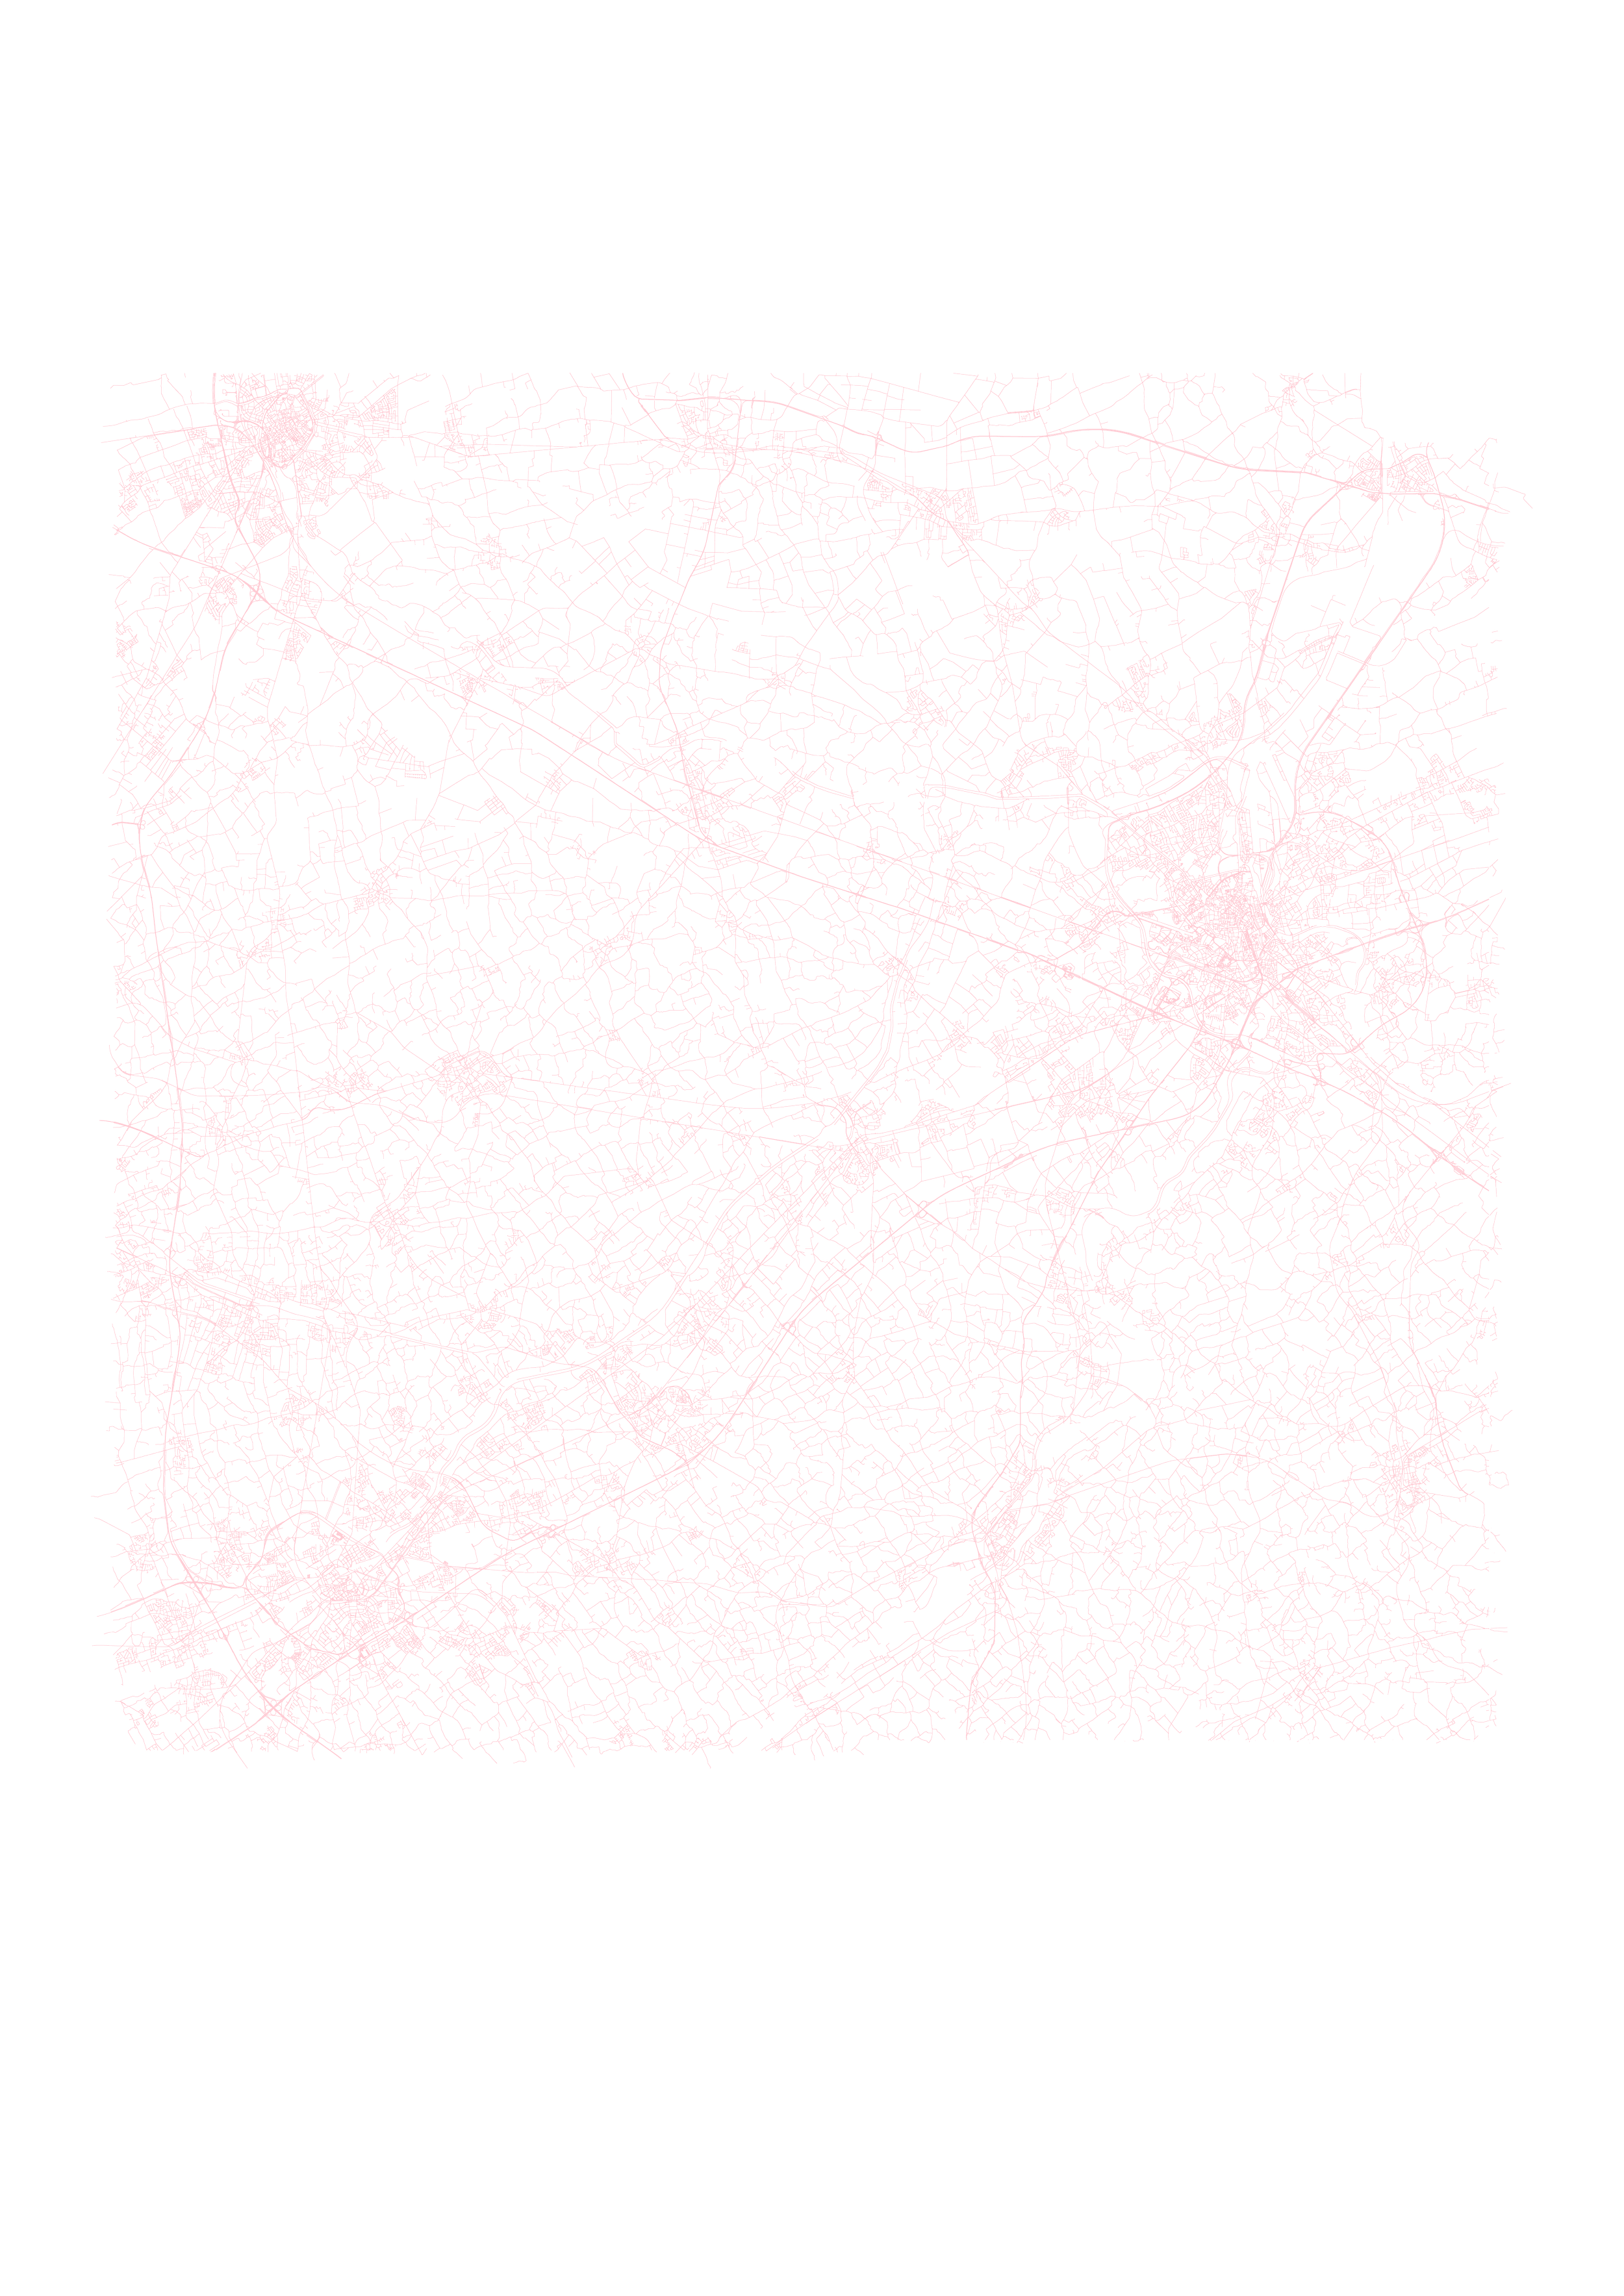
2019
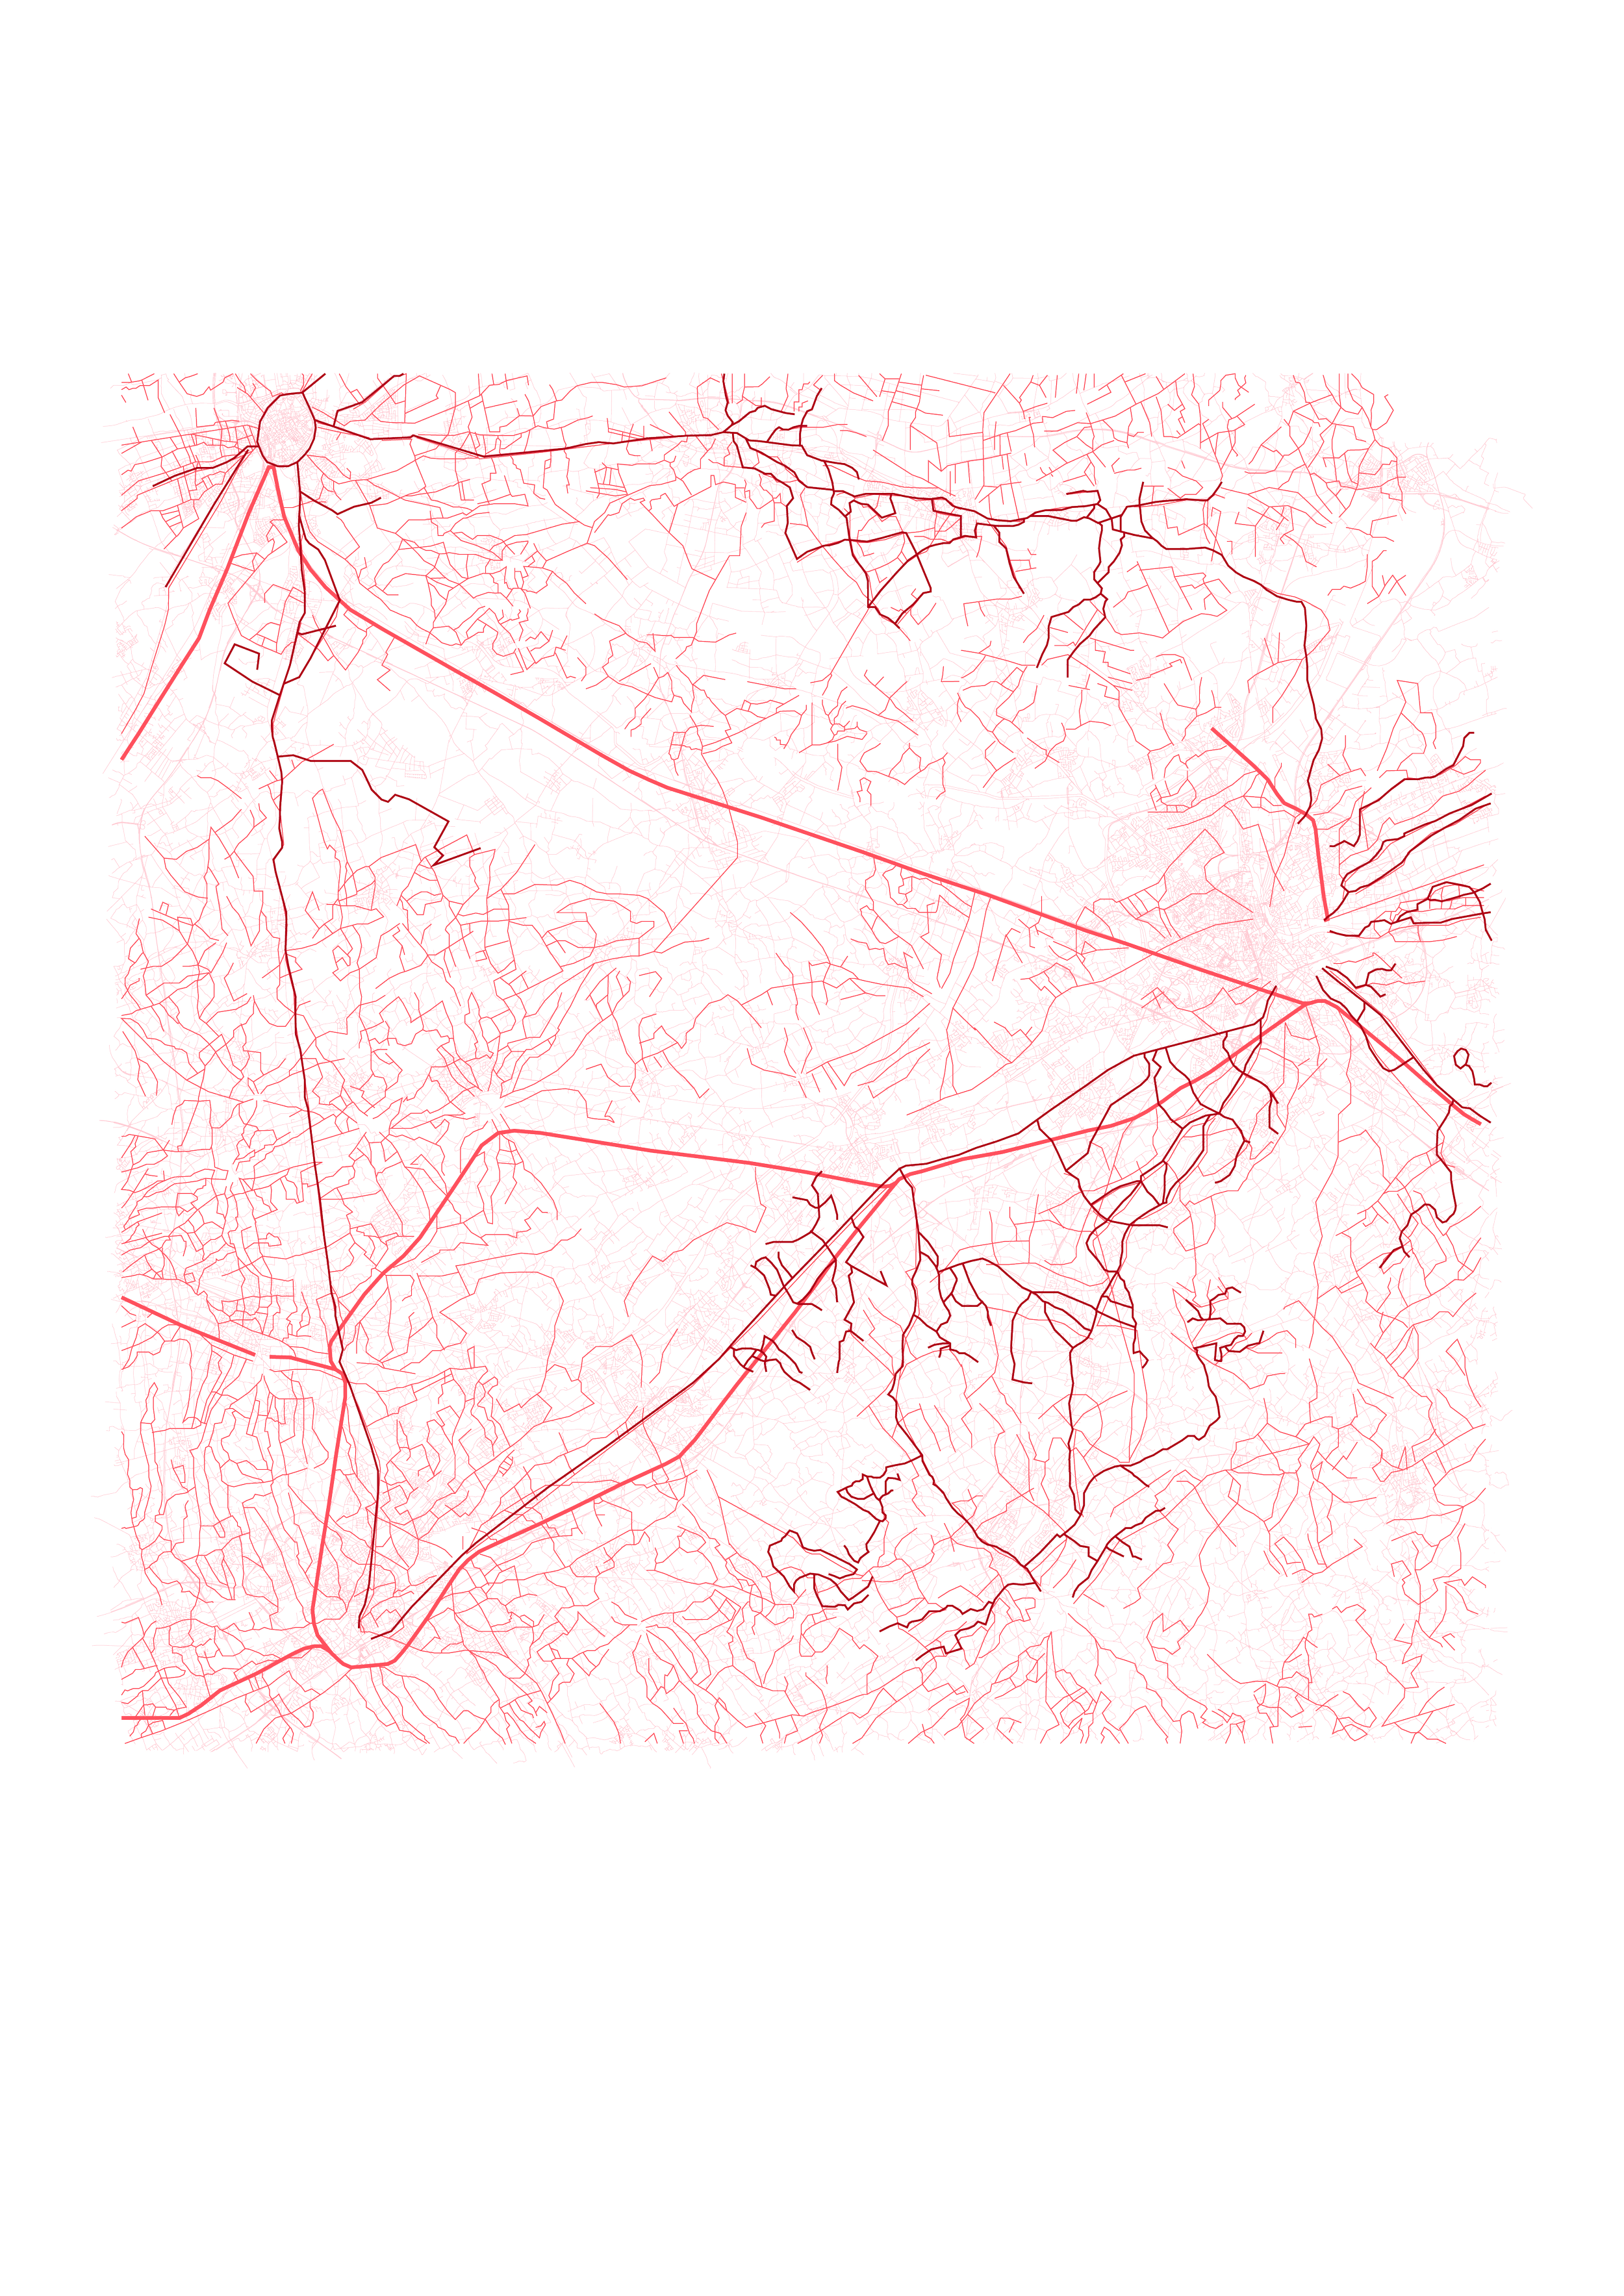
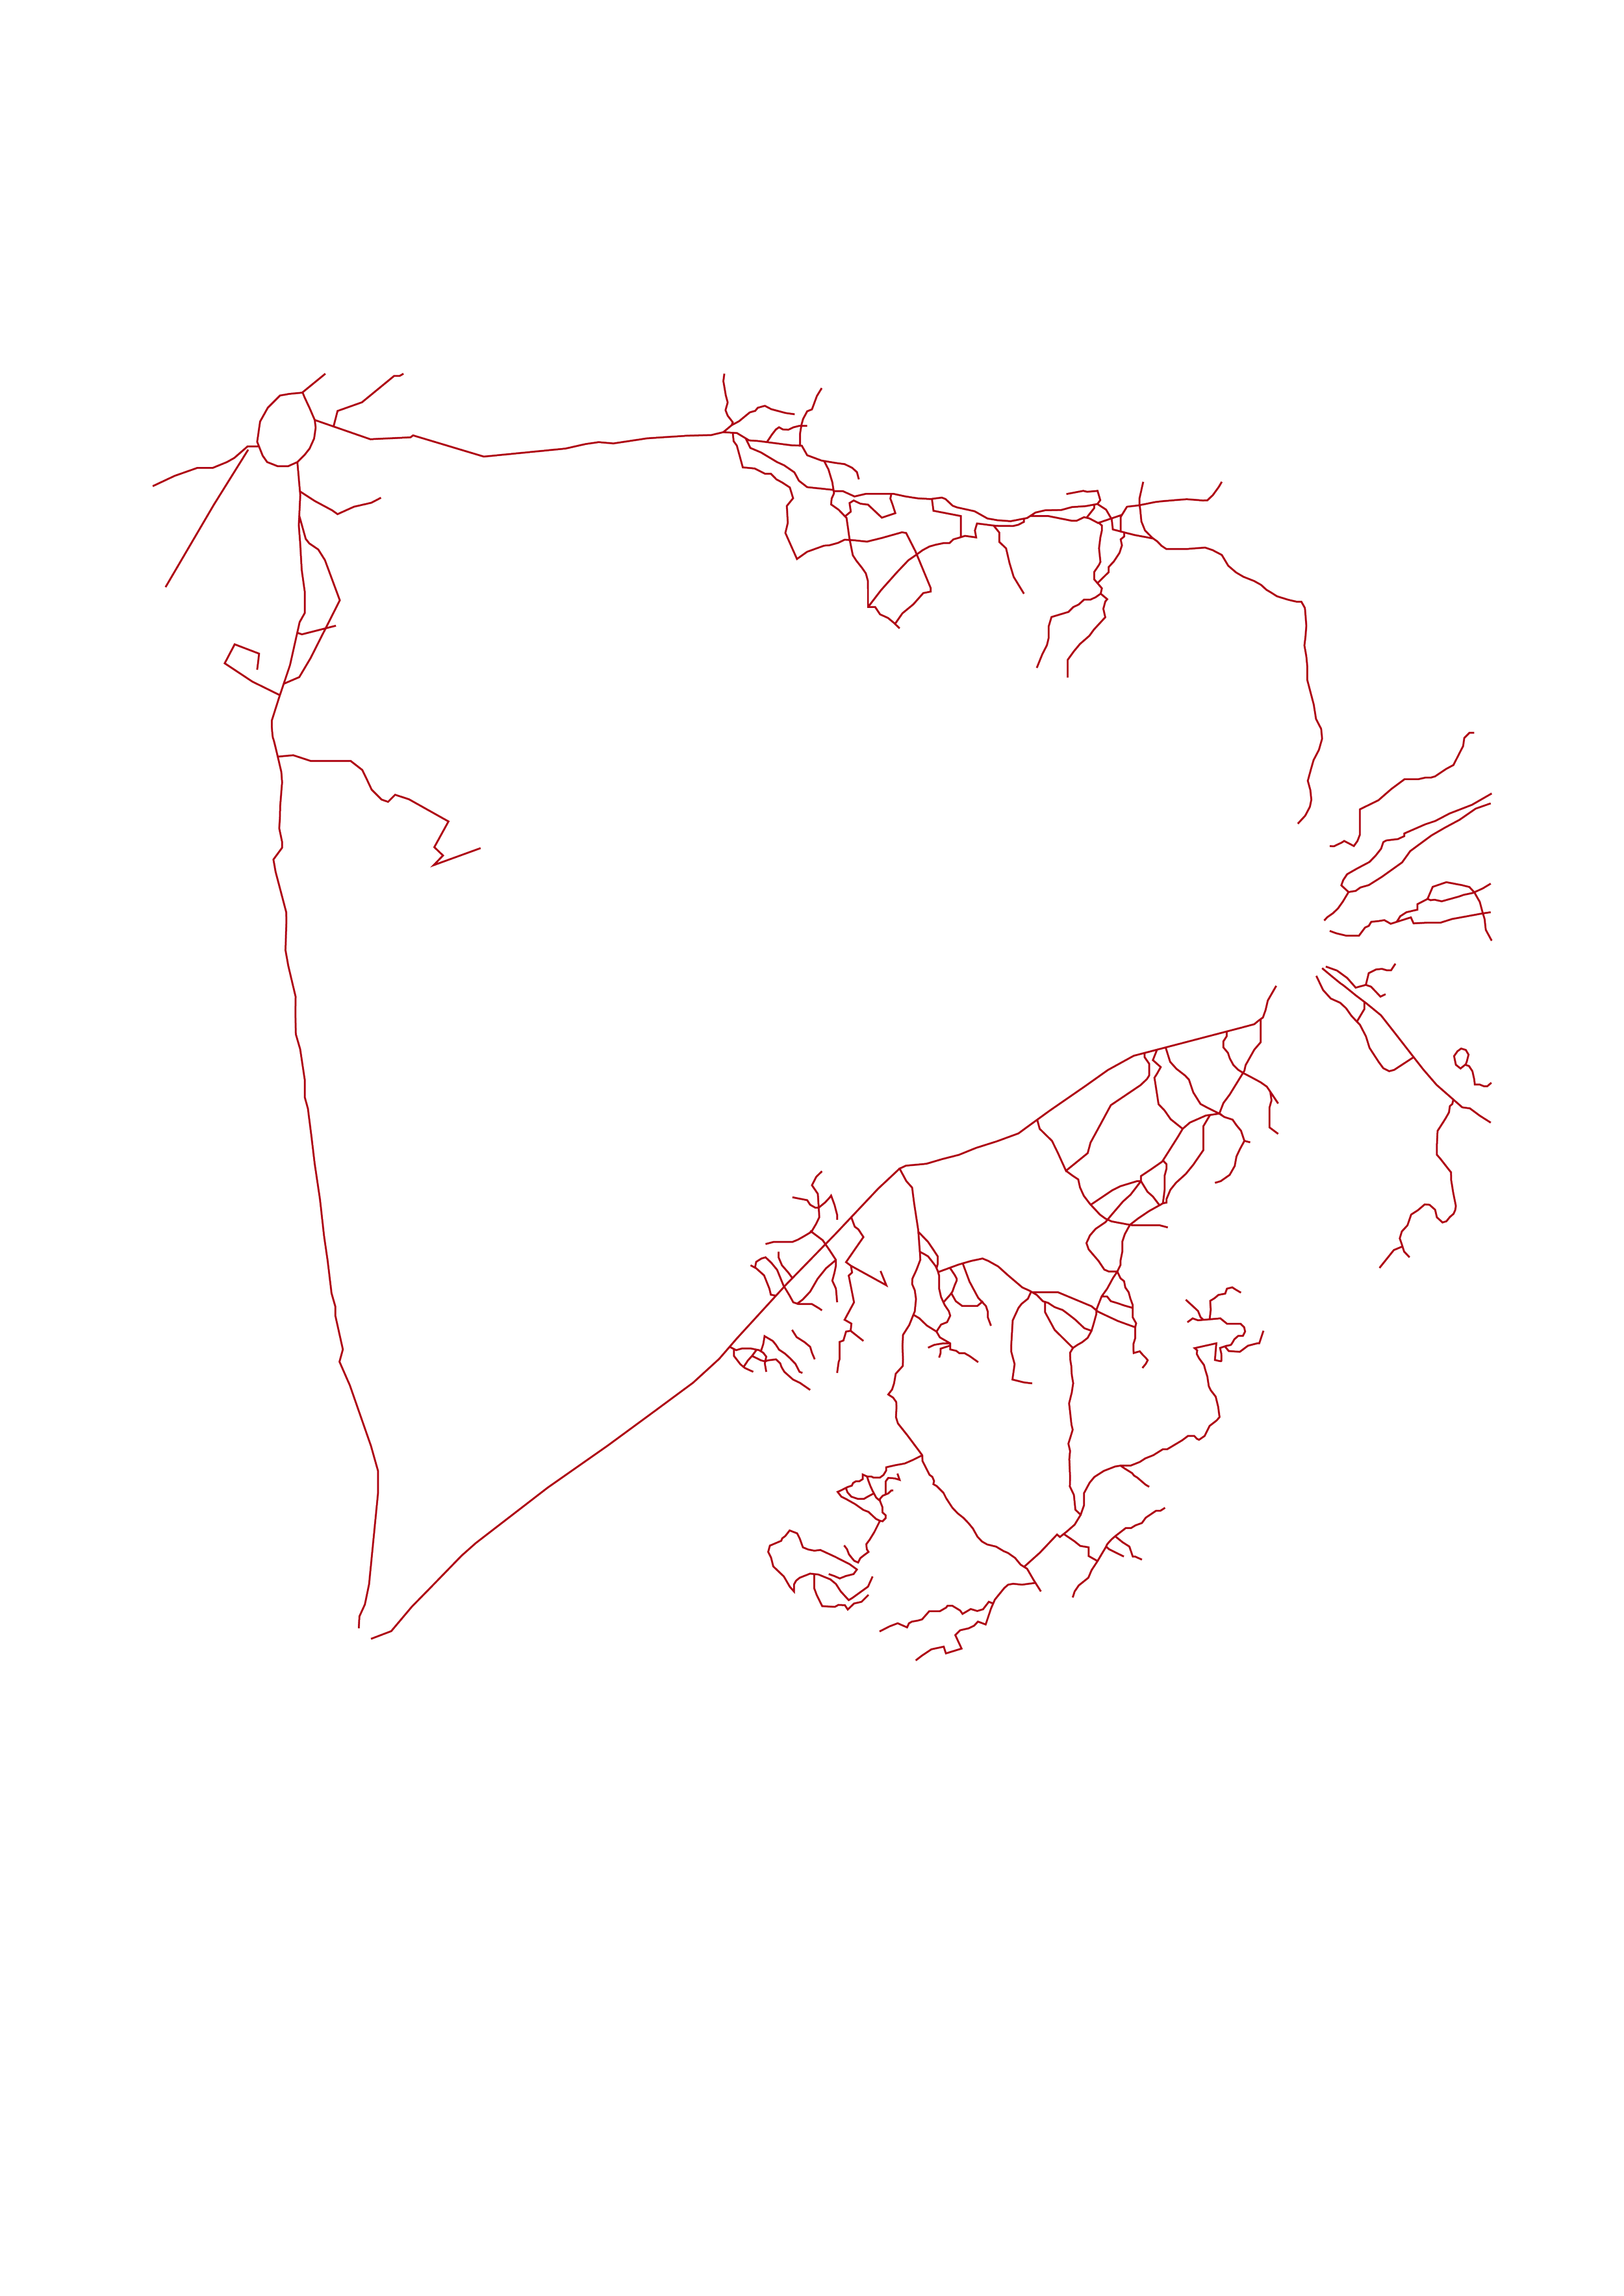
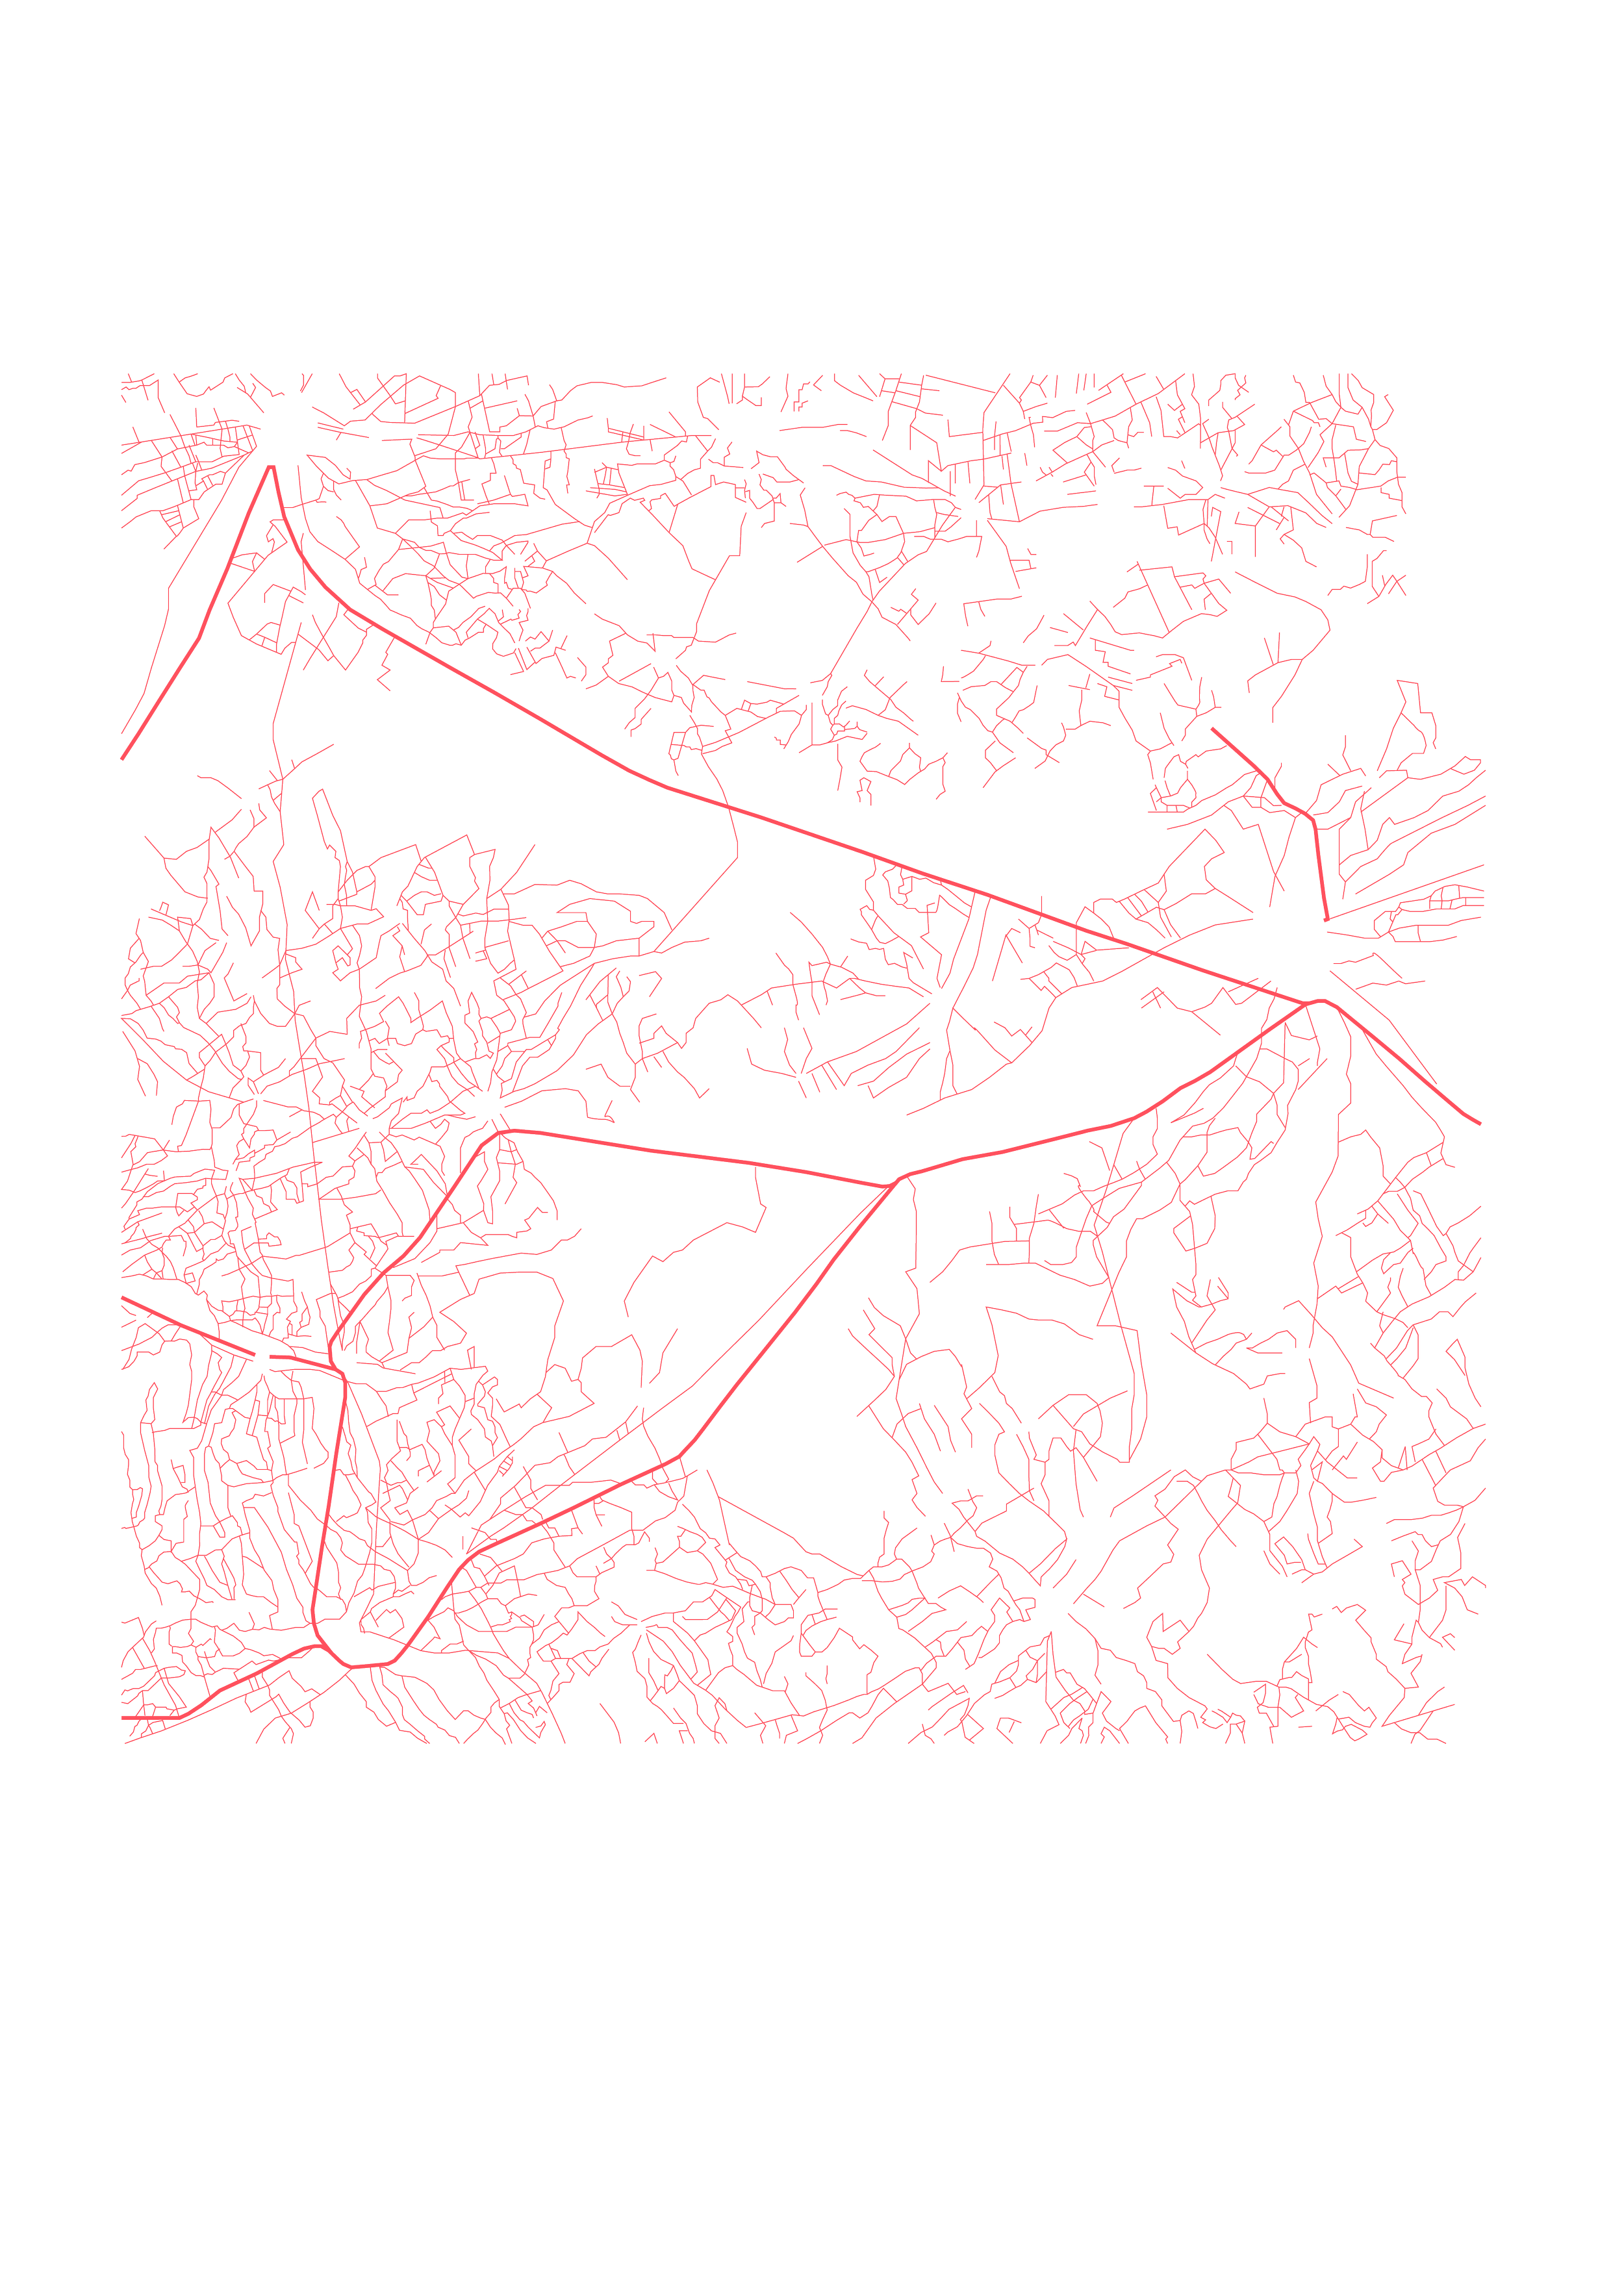
The web-like map displays the vast network of mobility in contemporary Flanders. It also begins to illustrate places of connection or isolation.
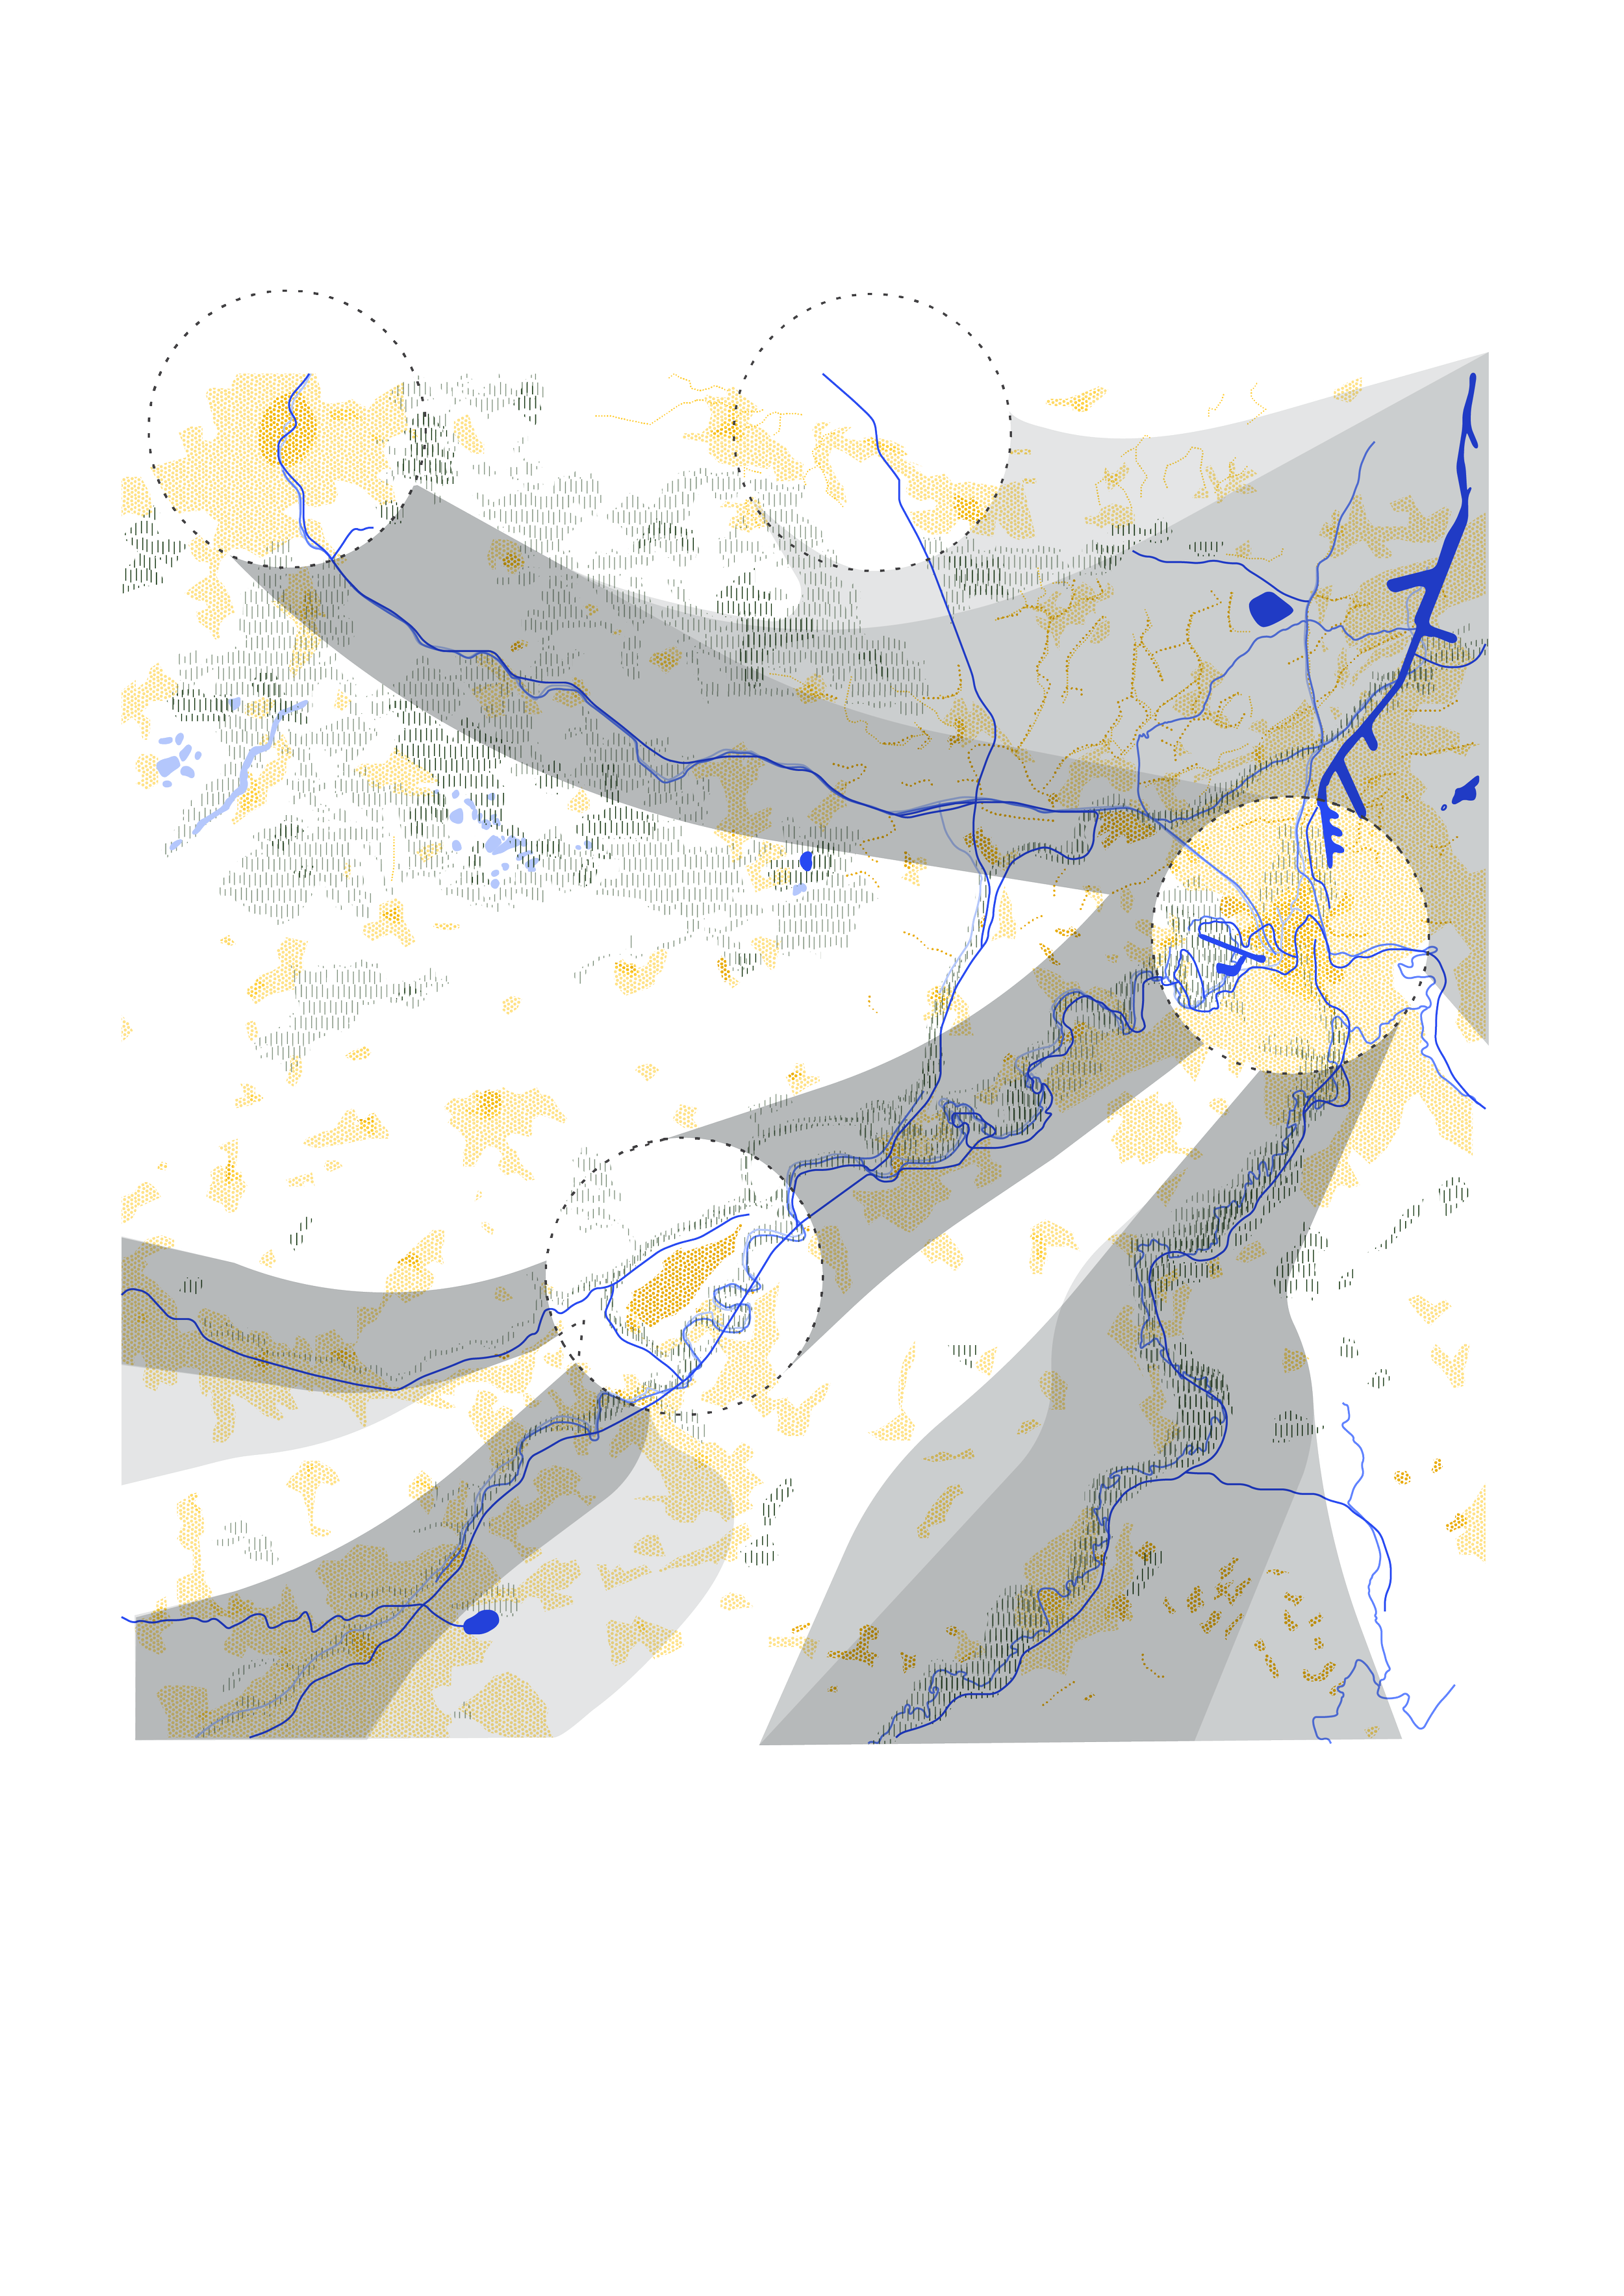
This analysis explores the connection between urban developments and connection to nature. One can observe that major urban hubs such as Brussels and Gent are connected by strong natural links and preserve natural green spaces.
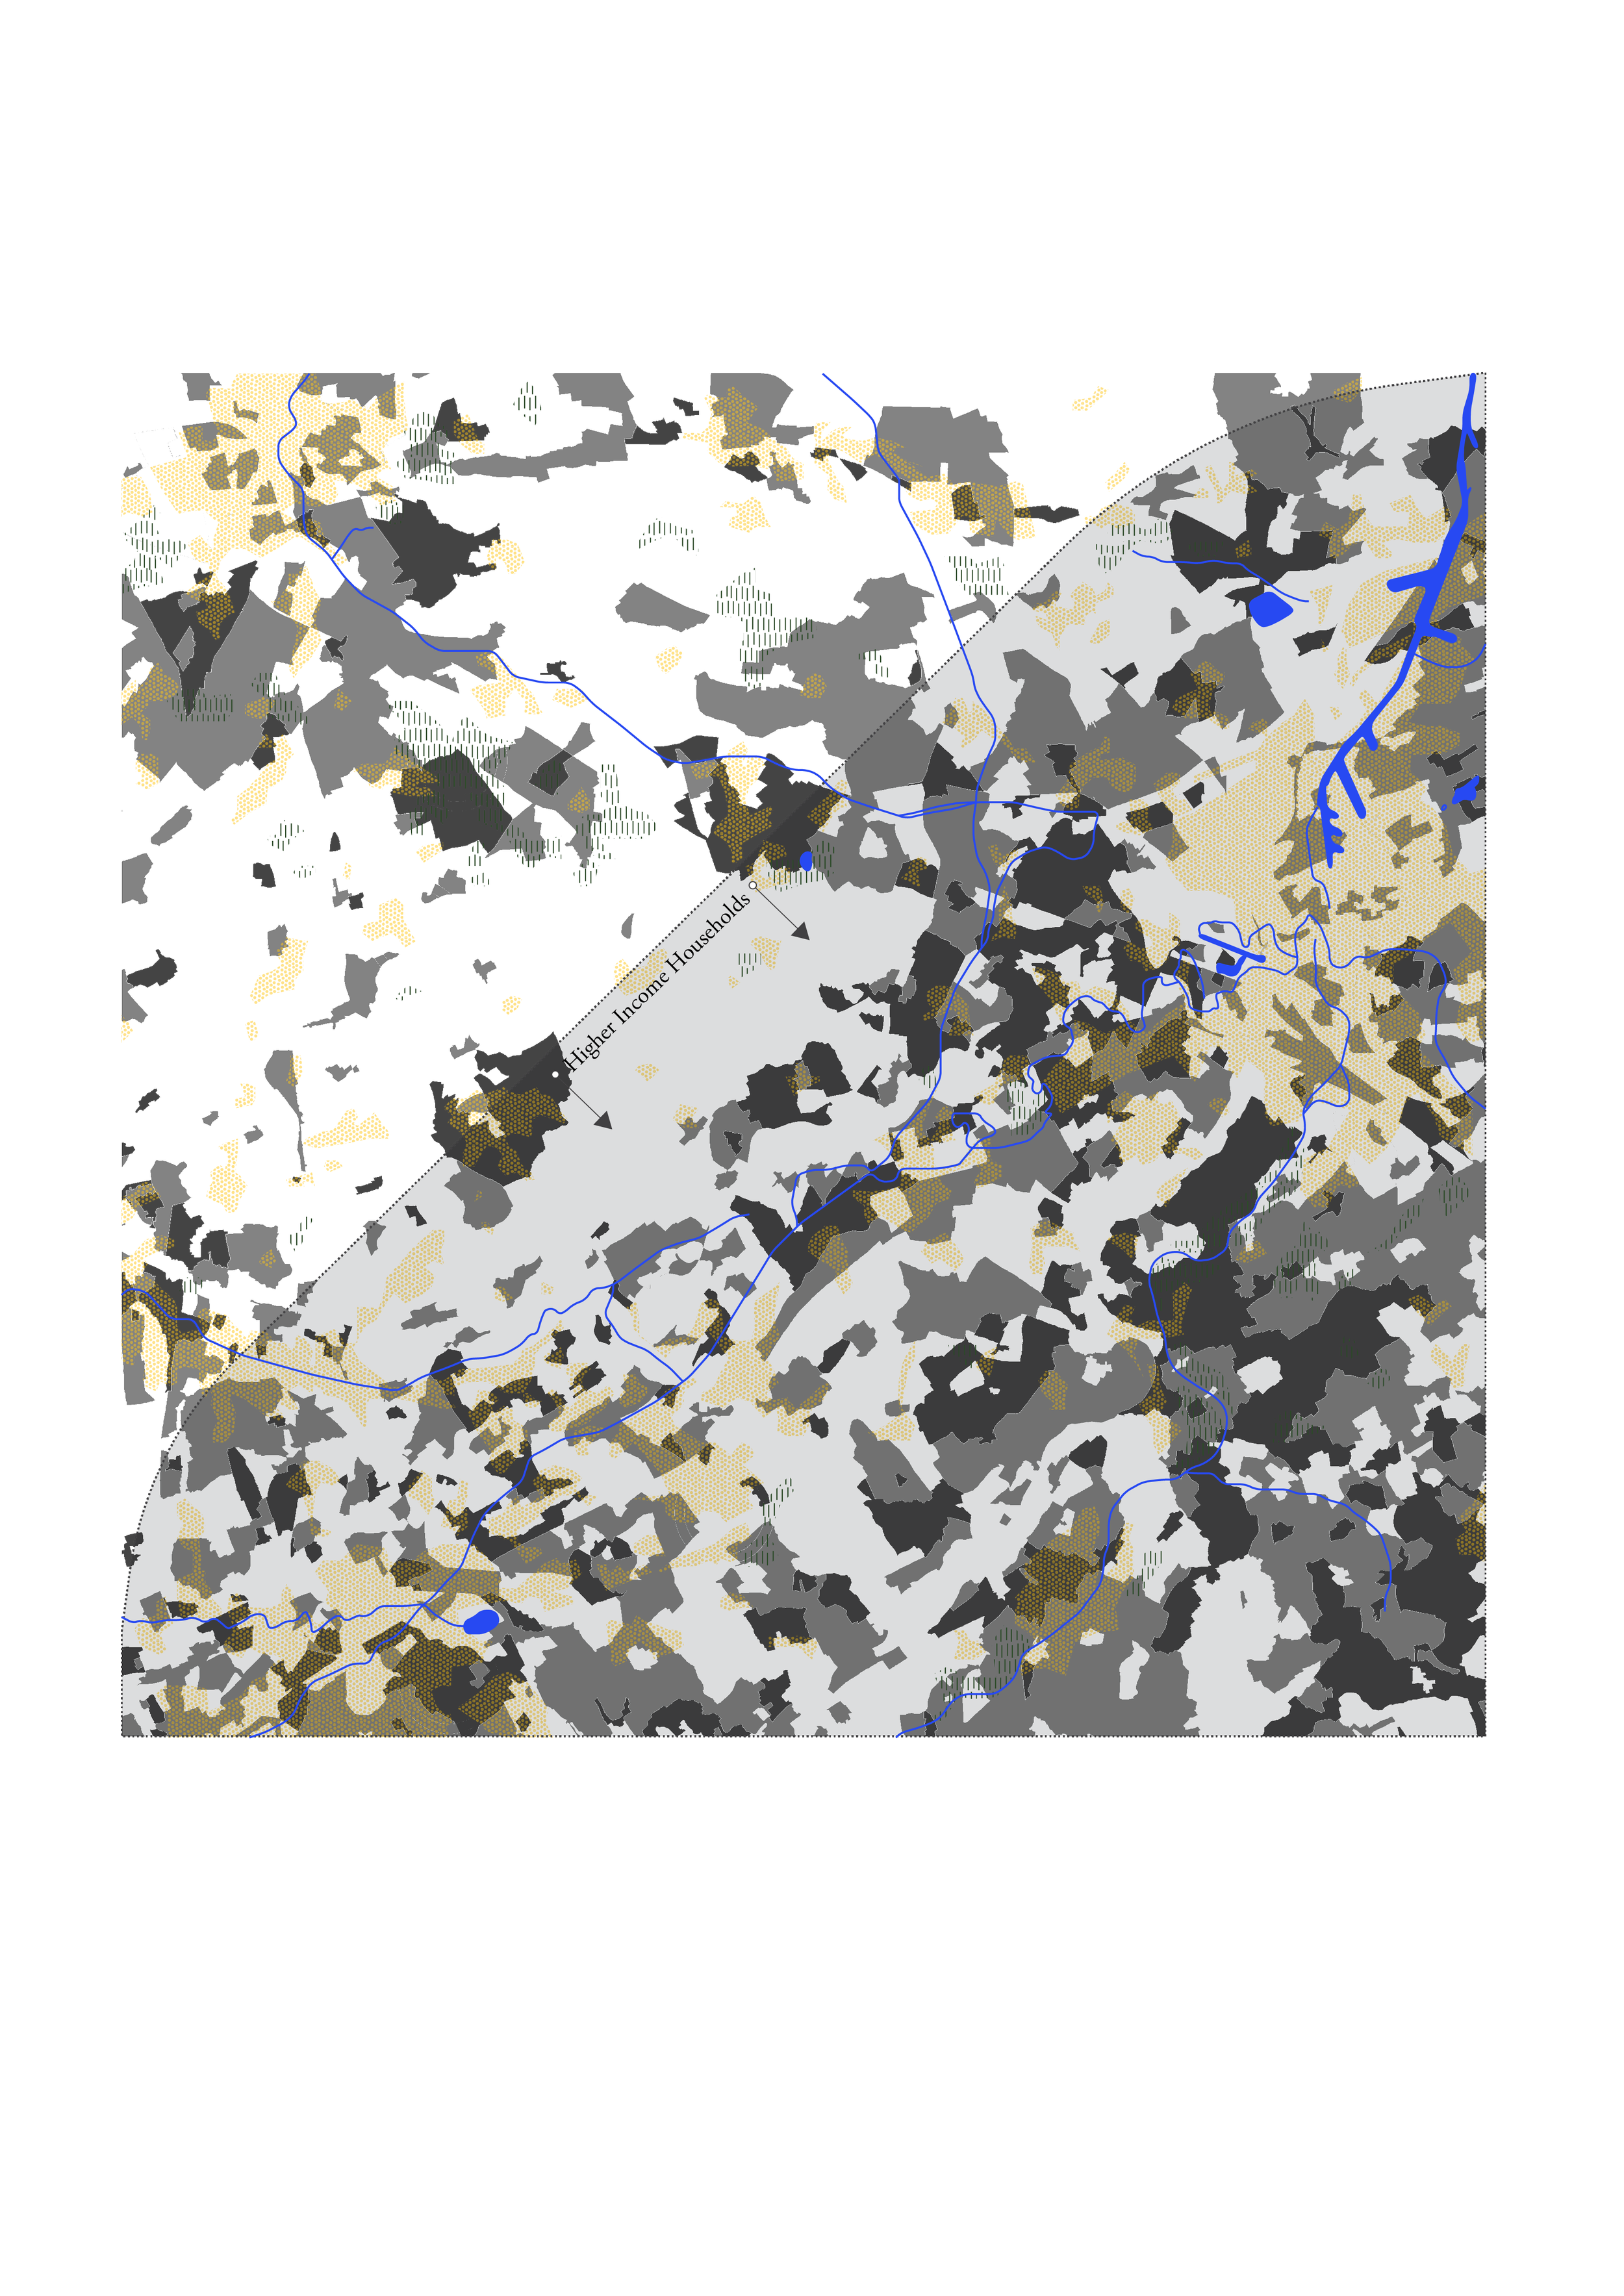
This analysis explores the connection between high-income households and connection to nature. The dark black areas display households with high incomes. It can be seen that they are mostly co-located amongst natural elements. The map below displays the opposite condition.
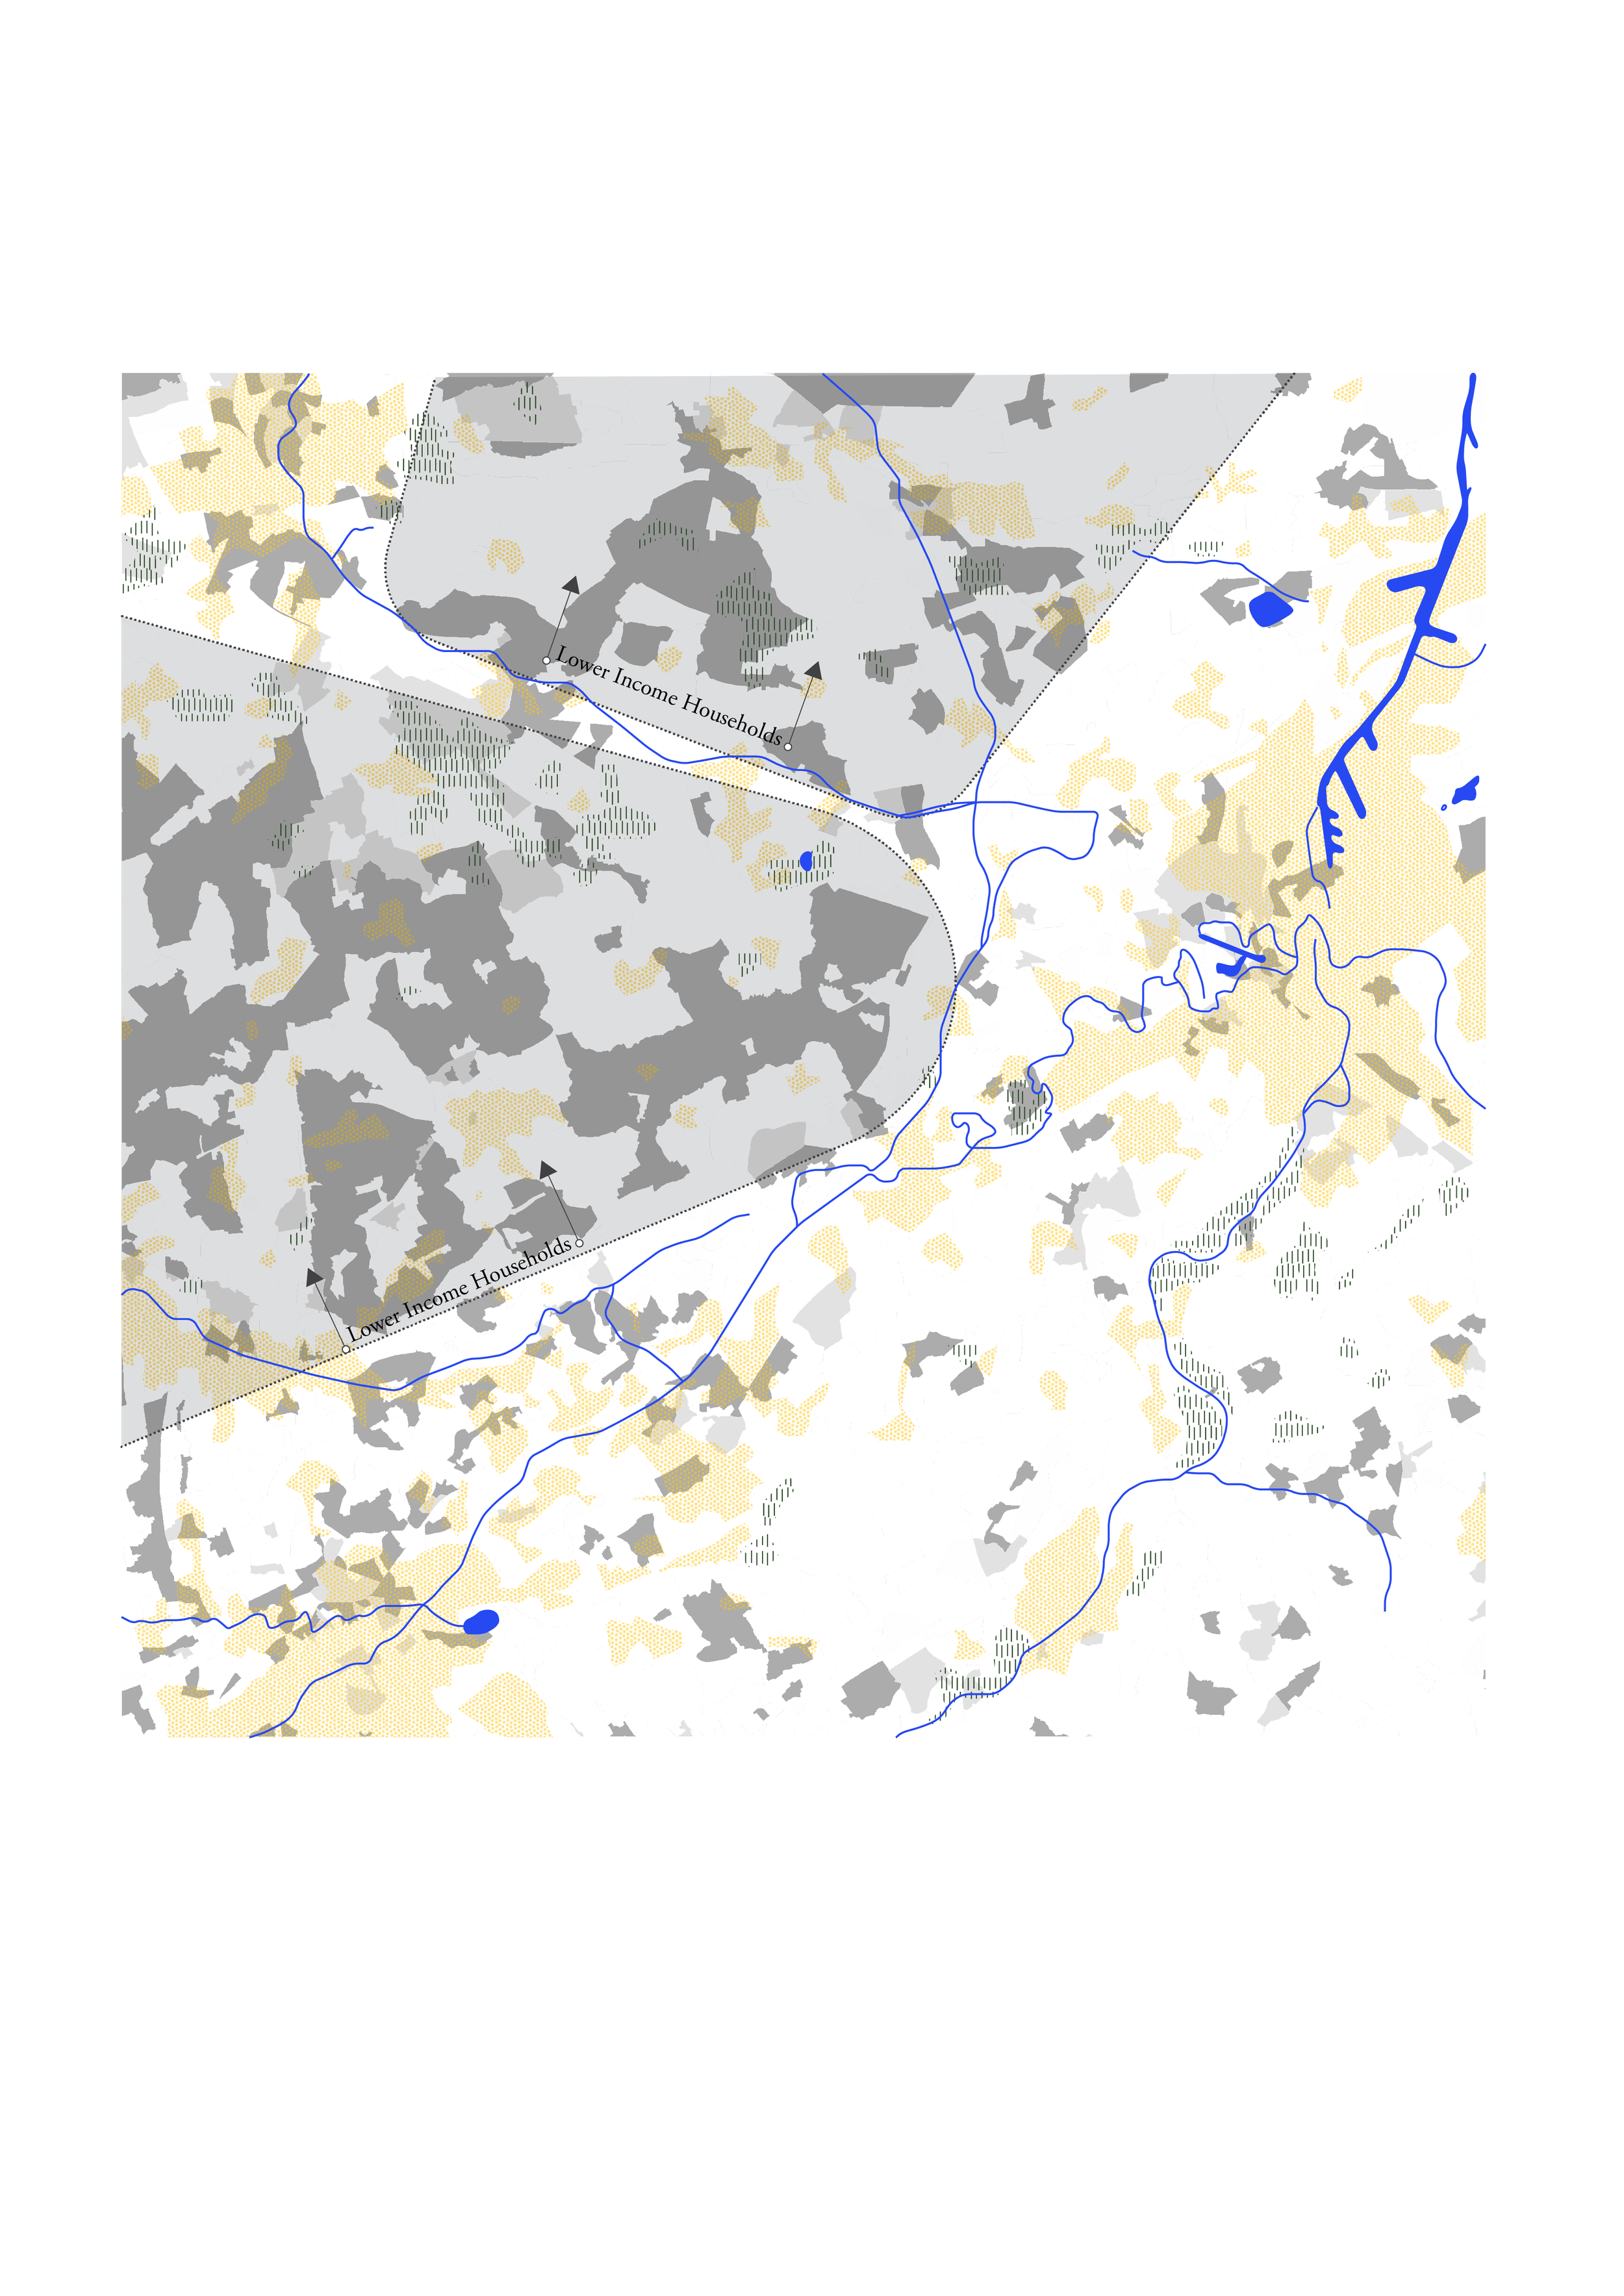
This analysis follows the previous map, highlighting the saturation of lower-income households in areas natural deficit.
